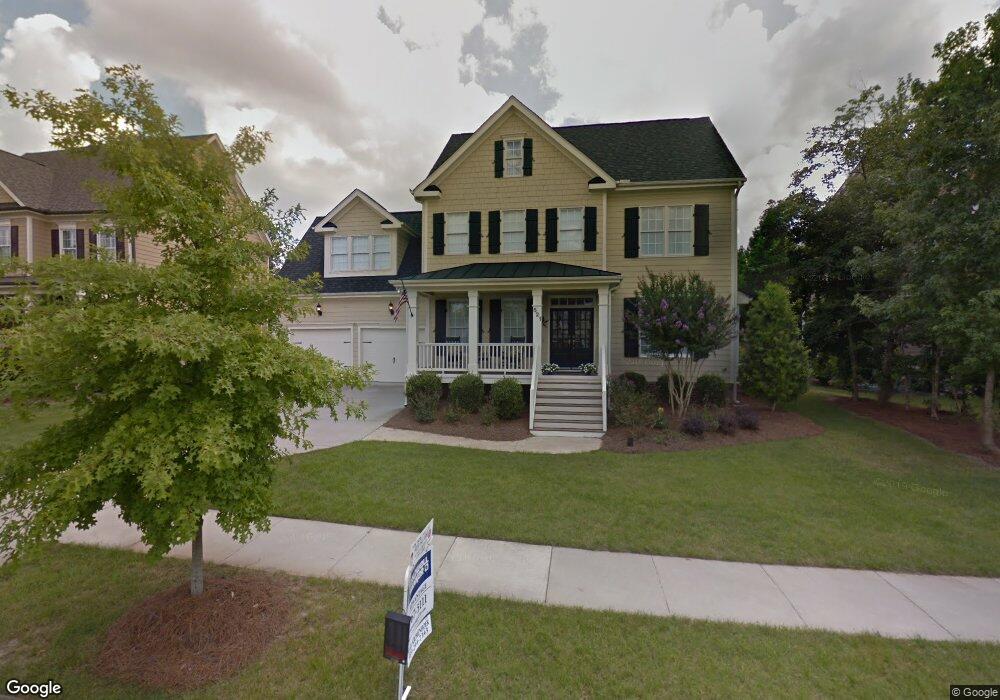
521 Wanderview Ln Holly Springs, NC 27540
Estimated Value: $696,754 - $786,000
4
Beds
4
Baths
2,921
Sq Ft
$254/Sq Ft
Est. Value
About This Home
This home is located at 521 Wanderview Ln, Holly Springs, NC 27540 and is currently estimated at $740,689, approximately $253 per square foot. 521 Wanderview Ln is a home located in Wake County with nearby schools including Middle Creek Elementary School, Holly Ridge Middle School, and Middle Creek High.
Ownership History
Date
Name
Owned For
Owner Type
Purchase Details
Closed on
May 27, 2021
Sold by
Hensley David M and Hensley Stephanie A
Bought by
Hensley David M
Current Estimated Value
Home Financials for this Owner
Home Financials are based on the most recent Mortgage that was taken out on this home.
Original Mortgage
$373,500
Outstanding Balance
$311,154
Interest Rate
2.9%
Mortgage Type
New Conventional
Estimated Equity
$429,535
Purchase Details
Closed on
Sep 24, 2008
Sold by
Djf Builders Inc
Bought by
Hensley David M and Hensley Stephanie A
Home Financials for this Owner
Home Financials are based on the most recent Mortgage that was taken out on this home.
Original Mortgage
$398,905
Interest Rate
6.49%
Mortgage Type
Purchase Money Mortgage
Purchase Details
Closed on
Feb 6, 2008
Sold by
Sso Llc
Bought by
Djf Builders Inc
Create a Home Valuation Report for This Property
The Home Valuation Report is an in-depth analysis detailing your home's value as well as a comparison with similar homes in the area
Home Values in the Area
Average Home Value in this Area
Purchase History
| Date | Buyer | Sale Price | Title Company |
|---|---|---|---|
| Hensley David M | -- | Acm Title | |
| Hensley David M | $420,000 | None Available | |
| Djf Builders Inc | $120,000 | None Available |
Source: Public Records
Mortgage History
| Date | Status | Borrower | Loan Amount |
|---|---|---|---|
| Open | Hensley David M | $373,500 | |
| Closed | Hensley David M | $398,905 |
Source: Public Records
Tax History Compared to Growth
Tax History
| Year | Tax Paid | Tax Assessment Tax Assessment Total Assessment is a certain percentage of the fair market value that is determined by local assessors to be the total taxable value of land and additions on the property. | Land | Improvement |
|---|---|---|---|---|
| 2025 | $5,766 | $667,716 | $120,000 | $547,716 |
| 2024 | $5,742 | $667,716 | $120,000 | $547,716 |
| 2023 | $4,837 | $446,578 | $72,000 | $374,578 |
| 2022 | $4,669 | $446,578 | $72,000 | $374,578 |
| 2021 | $4,582 | $446,578 | $72,000 | $374,578 |
| 2020 | $4,582 | $446,578 | $72,000 | $374,578 |
| 2019 | $5,018 | $415,387 | $72,000 | $343,387 |
| 2018 | $4,535 | $415,387 | $72,000 | $343,387 |
| 2017 | $4,371 | $415,387 | $72,000 | $343,387 |
| 2016 | $4,311 | $413,799 | $72,000 | $341,799 |
| 2015 | $3,874 | $367,248 | $58,000 | $309,248 |
| 2014 | -- | $367,248 | $58,000 | $309,248 |
Source: Public Records
Map
Nearby Homes
- 129 Middlegreen Place
- 436 Edgepine Dr
- 4805 Leithcroft Place
- 212 Chieftain Dr
- 108 Eden Glen Dr
- 112 Skygrove Dr
- 101 Eden Glen Dr
- 221 Grantwood Dr
- 204 Edgepine Dr
- 121 Amberglen Ln
- 228 Grantwood Dr
- 104 Amberglen Ln
- 608 Skygrove Dr
- 5340 Serene Forest Dr
- 120 Breyla Way
- 501 Wescott Ridge Dr
- 0 Optimist Farm Rd Unit 10126506
- 308 Wescott Ridge Dr
- 213 Cross Oaks Place
- 109 Skywater Ln
- 525 Wanderview Ln
- 517 Wanderview Ln
- 513 Wanderview Ln
- 529 Wanderview Ln
- 104 Briarburn Ln
- 108 Briarburn Ln
- 100 Briarburn Ln
- 532 Wanderview Ln
- 528 Wanderview Ln
- 509 Wanderview Ln
- 536 Wanderview Ln
- 533 Wanderview Ln
- 112 Briarburn Ln
- 524 Wanderview Ln
- 540 Wanderview Ln
- 520 Wanderview Ln
- 537 Wanderview Ln
- 505 Wanderview Ln
- 501 Wanderview Ln
- 109 Briarburn Ln