

521 Windsor St Reading, PA 19601
Estimated payment $1,374/month
Highlights
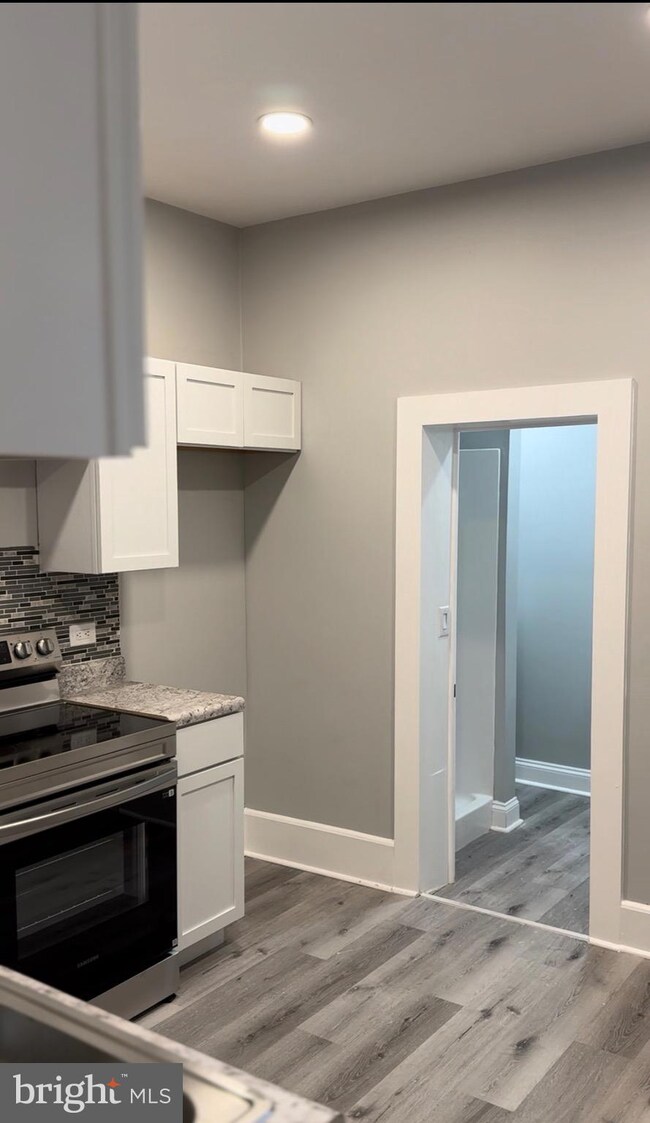
- Wood Flooring
- No HOA
- Hot Water Heating System
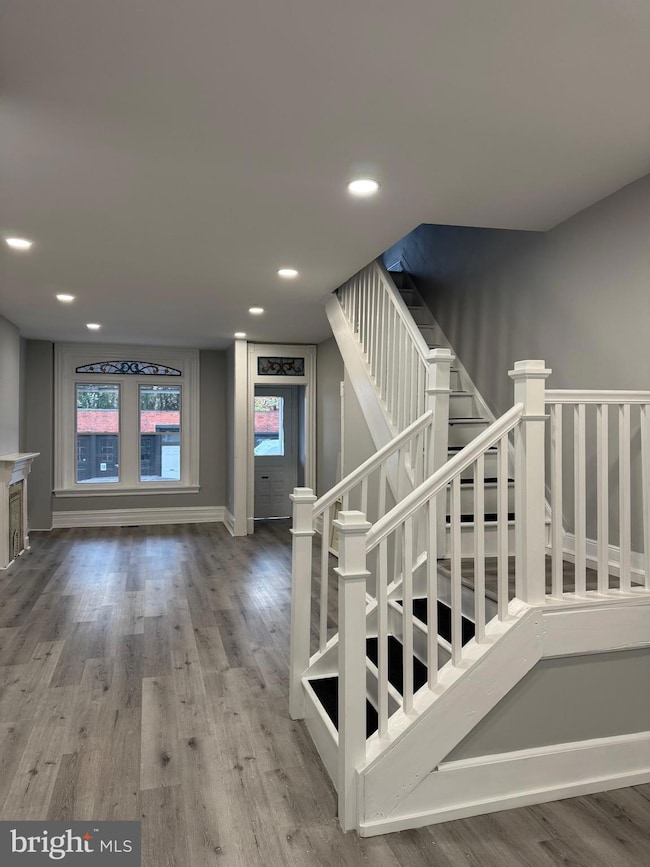
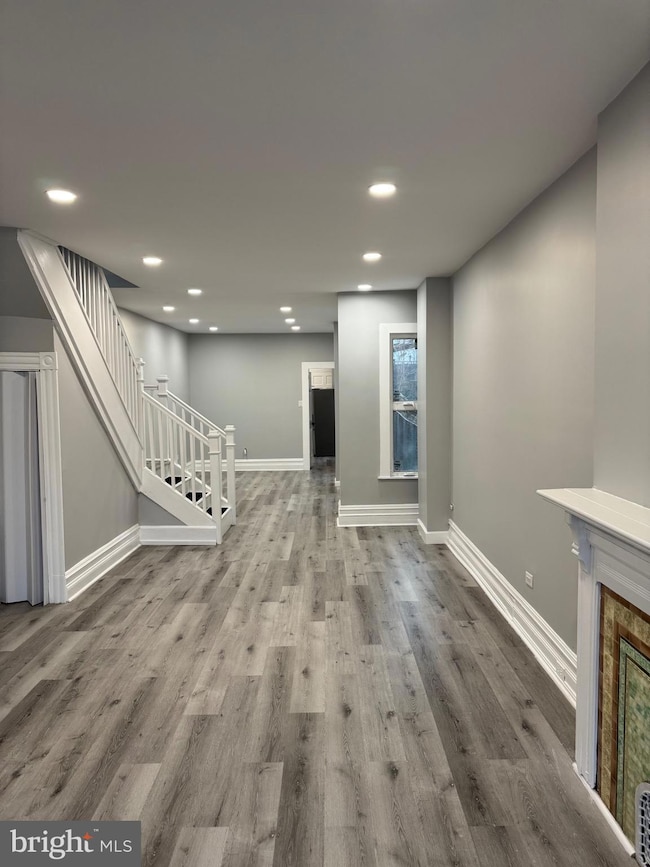
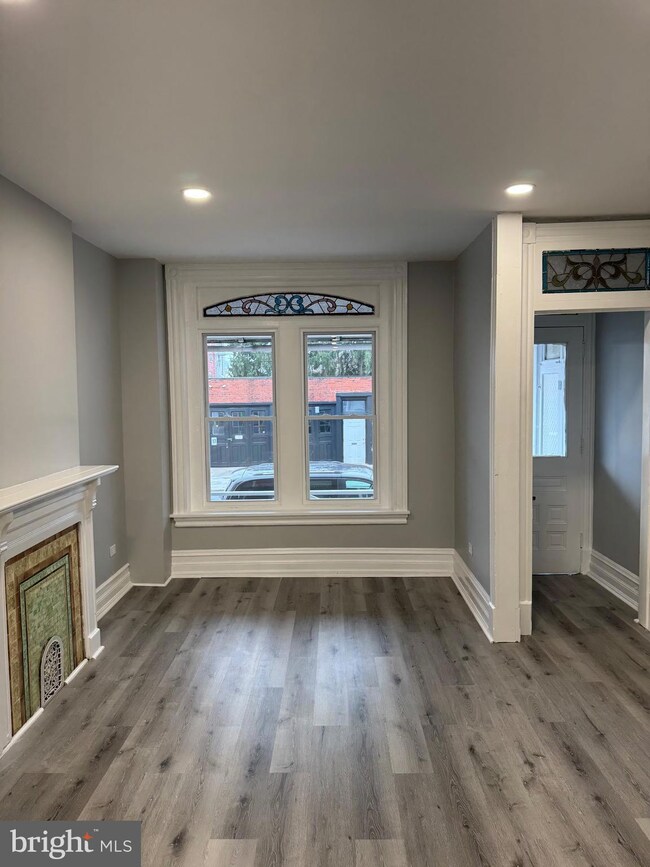
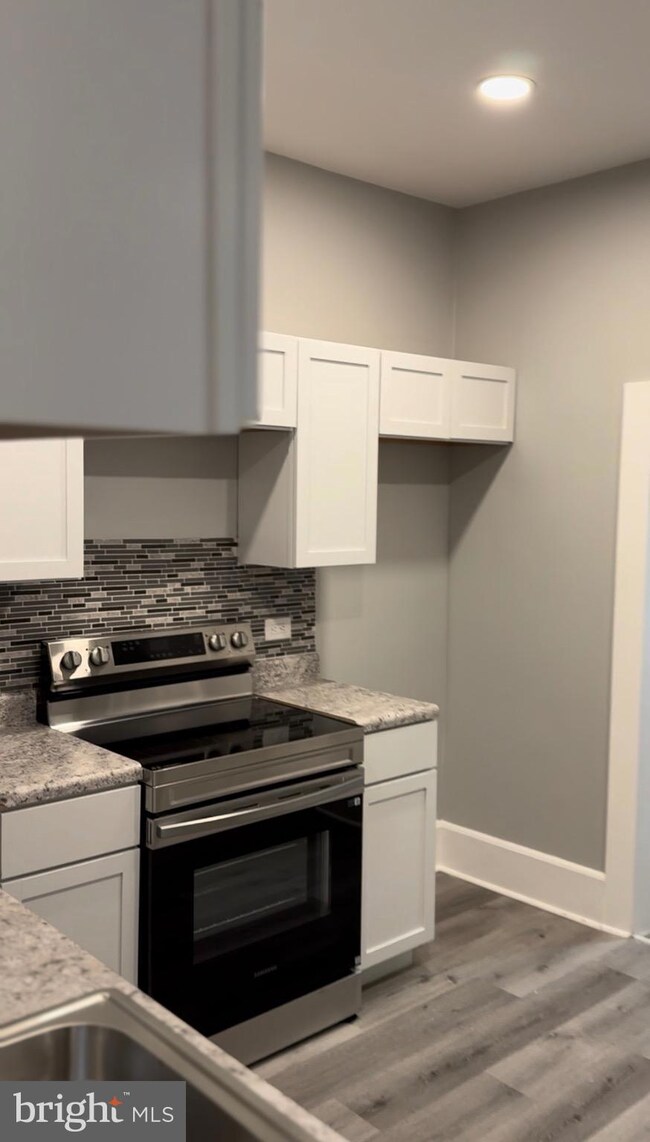
About This Home
Fully renovated historic townhouse located in the heart of Reading, PA. This home features 6 private and spacious bedrooms along with 2 full bathrooms. Schedule your showing today!
Listing Agent
(610) 373-9900 melanie.cejamunoz@cbrealty.com Coldwell Banker Realty License #RS376867 Listed on: 12/16/2025

Co-Listing Agent
(610) 373-9900 alexis.frutos@cbhomes.com Coldwell Banker Realty License #RS350841
Townhouse Details
Home Type
- Townhome
Est. Annual Taxes
- $2,136
Year Built
- Built in 1880
Lot Details
- 1,306 Sq Ft Lot
Parking
- On-Street Parking
Home Design
- Brick Exterior Construction
- Rubber Roof
- Concrete Perimeter Foundation
Interior Spaces
- 1,989 Sq Ft Home
- Property has 3 Levels
- Basement
- Interior and Exterior Basement Entry
- Electric Oven or Range
Flooring
- Wood
- Vinyl
Bedrooms and Bathrooms
- 6 Bedrooms
Utilities
- Heating System Uses Natural Gas
- Hot Water Heating System
- Electric Water Heater
Community Details
- No Home Owners Association
- Reading Subdivision
Listing and Financial Details
- Tax Lot 0244
- Assessor Parcel Number 14-5307-51-85-0244
Map
Tax History
| Year | Tax Paid | Tax Assessment Tax Assessment Total Assessment is a certain percentage of the fair market value that is determined by local assessors to be the total taxable value of land and additions on the property. | Land | Improvement |
|---|---|---|---|---|
| 2025 | $1,287 | $47,400 | $12,000 | $35,400 |
| 2024 | $2,105 | $47,400 | $12,000 | $35,400 |
| 2023 | $2,072 | $47,400 | $12,000 | $35,400 |
| 2022 | $2,072 | $47,400 | $12,000 | $35,400 |
| 2021 | $2,072 | $47,400 | $12,000 | $35,400 |
| 2020 | $2,051 | $47,400 | $12,000 | $35,400 |
| 2019 | $2,051 | $47,400 | $12,000 | $35,400 |
| 2018 | $2,051 | $47,400 | $12,000 | $35,400 |
| 2017 | $2,038 | $47,400 | $12,000 | $35,400 |
| 2016 | $1,164 | $47,400 | $12,000 | $35,400 |
| 2015 | $1,164 | $47,400 | $12,000 | $35,400 |
| 2014 | $1,071 | $47,400 | $12,000 | $35,400 |
Property History
| Date | Event | Price | List to Sale | Price per Sq Ft |
|---|---|---|---|---|
| 12/16/2025 12/16/25 | For Sale | $229,900 | -- | $116 / Sq Ft |
Purchase History
| Date | Type | Sale Price | Title Company |
|---|---|---|---|
| Deed | $229,900 | Golden Gate Settlement Group L | |
| Deed | $5,000 | Stewart Title Guaranty Company | |
| Deed | $1,500 | None Available | |
| Deed | $47,400 | -- |
Mortgage History
| Date | Status | Loan Amount | Loan Type |
|---|---|---|---|
| Open | $52,475 | New Conventional | |
| Open | $183,920 | New Conventional |
Source: Bright MLS
MLS Number: PABK2066488
APN: 14-5307-51-85-0244
Disclaimer: Certain information contained herein is derived from information provided by parties other than Homes.com. All information provided is deemed reliable, but is not guaranteed to be accurate and should be independently verified.
![]() The data relating to real estate for sale on this website appears in part through the BRIGHT Internet Data Exchange program, a voluntary cooperative exchange of property listing data between licensed real estate brokerage firms, and is provided by BRIGHT through a licensing agreement.
The data relating to real estate for sale on this website appears in part through the BRIGHT Internet Data Exchange program, a voluntary cooperative exchange of property listing data between licensed real estate brokerage firms, and is provided by BRIGHT through a licensing agreement.
Listing information is from various brokers who participate in the Bright MLS IDX program and not all listings may be visible on the site.
The property information being provided on or through the website is for the personal, non-commercial use of consumers and such information may not be used for any purpose other than to identify prospective properties consumers may be interested in purchasing.
Some properties which appear for sale on the website may no longer be available because they are for instance, under contract, sold or are no longer being offered for sale.
Property information displayed is deemed reliable but is not guaranteed.
Copyright 2026 Bright MLS, Inc.
- 537 Windsor St
- 920 N 5th St Unit 1
- 738 N 3rd St Unit 3
- 640 N 3rd St Unit 3
- 165 Douglass St Unit 3
- 410 N 6th St Unit 2R
- 960 N 11th St Unit 2A
- 520 N 10th St
- 515 Elm St
- 821 Lincoln St Unit 2
- 1060 Pike St
- 317 N Front St
- 230 N 9th St
- 501 Washington St
- 1020B Penn St
- 100 S 4th St
- 40 Maple St
- 531 Chestnut St Unit 3
- 531 Chestnut St Unit 1
- 531 Chestnut St Unit 2
Ask me questions while you tour the home.