T
Landlord's Agent in 2023
Tanika Tanika Ford
Progress Residential Property Manager, LLC.
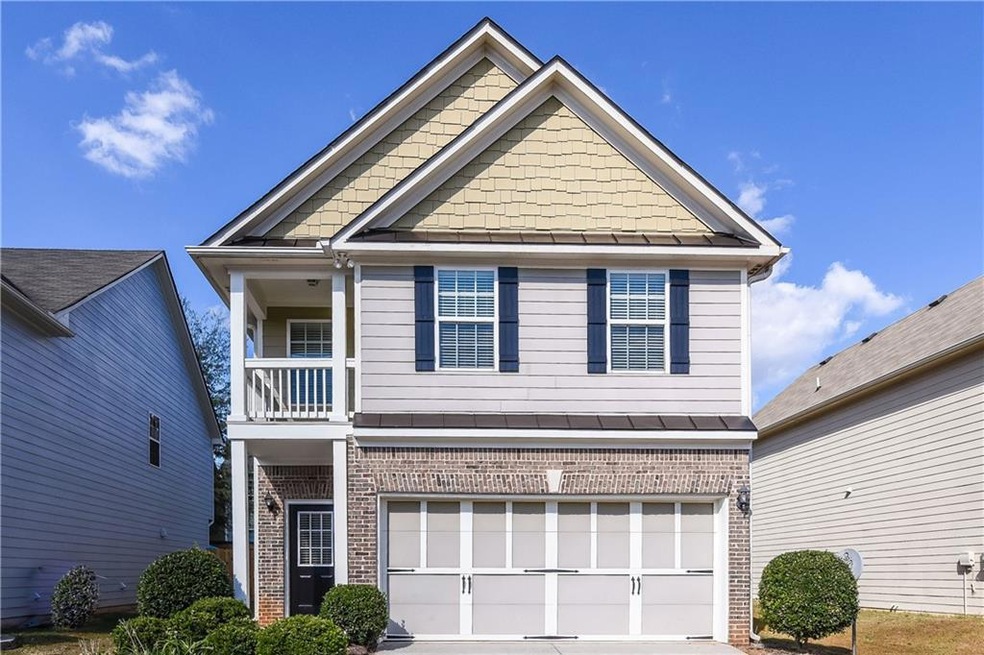
Estimated Value: $386,000 - $422,000
Interested in this home? You clearly have exceptional taste. Like all our homes, this one features: a great location in a desirable neighborhood, a comfortable layout with good-sized bedrooms and bathrooms, a great kitchen with plenty of counter and cabinet space, many updated and upgraded features, central HVAC and programmable thermostat, garage and a spacious yard, and it's pet friendly.
Last Agent to Rent the Property
Tanika Tanika Ford
Progress Residential Property Manager, LLC. License #334101 Listed on: 05/04/2023
Last Renter's Agent
Tanika Tanika Ford
Progress Residential Property Manager, LLC. License #334101 Listed on: 05/04/2023
| Date | Buyer | Sale Price | Title Company |
|---|---|---|---|
| Progress Residential Borrower | -- | -- | |
| Freo Georgia Llc | $173,000 | -- | |
| Pace Barbara J | $95,000 | -- |
| Date | Event | Price | List to Sale | Price per Sq Ft | Prior Sale |
|---|---|---|---|---|---|
| 06/23/2023 06/23/23 | Rented | $2,540 | 0.0% | -- | |
| 06/16/2023 06/16/23 | Under Contract | -- | -- | -- | |
| 06/13/2023 06/13/23 | For Rent | $2,540 | 0.0% | -- | |
| 05/30/2023 05/30/23 | Under Contract | -- | -- | -- | |
| 05/04/2023 05/04/23 | For Rent | $2,540 | +16.0% | -- | |
| 03/26/2022 03/26/22 | Rented | $2,190 | 0.0% | -- | |
| 03/18/2022 03/18/22 | Under Contract | -- | -- | -- | |
| 03/16/2022 03/16/22 | Price Changed | $2,190 | +1.9% | $1 / Sq Ft | |
| 03/15/2022 03/15/22 | Price Changed | $2,150 | -0.7% | $1 / Sq Ft | |
| 03/10/2022 03/10/22 | Price Changed | $2,165 | 0.0% | $1 / Sq Ft | |
| 03/10/2022 03/10/22 | For Rent | $2,165 | +1.9% | -- | |
| 02/25/2022 02/25/22 | Under Contract | -- | -- | -- | |
| 02/22/2022 02/22/22 | For Rent | $2,125 | +13.9% | -- | |
| 03/02/2021 03/02/21 | Rented | $1,865 | 0.0% | -- | |
| 02/16/2021 02/16/21 | Under Contract | -- | -- | -- | |
| 02/10/2021 02/10/21 | Price Changed | $1,865 | -3.6% | $1 / Sq Ft | |
| 02/03/2021 02/03/21 | Price Changed | $1,935 | -0.5% | $1 / Sq Ft | |
| 02/01/2021 02/01/21 | Price Changed | $1,945 | -2.0% | $1 / Sq Ft | |
| 01/28/2021 01/28/21 | Price Changed | $1,985 | 0.0% | $1 / Sq Ft | |
| 01/28/2021 01/28/21 | For Rent | $1,985 | -0.8% | -- | |
| 01/25/2021 01/25/21 | Under Contract | -- | -- | -- | |
| 01/20/2021 01/20/21 | Price Changed | $2,000 | +7.0% | $1 / Sq Ft | |
| 01/19/2021 01/19/21 | Price Changed | $1,870 | 0.0% | $1 / Sq Ft | |
| 01/19/2021 01/19/21 | For Rent | $1,870 | -3.1% | -- | |
| 01/15/2021 01/15/21 | Under Contract | -- | -- | -- | |
| 01/12/2021 01/12/21 | Price Changed | $1,930 | +1.6% | $1 / Sq Ft | |
| 01/12/2021 01/12/21 | Price Changed | $1,900 | +1.9% | $1 / Sq Ft | |
| 01/06/2021 01/06/21 | Price Changed | $1,865 | +0.3% | $1 / Sq Ft | |
| 12/16/2020 12/16/20 | Price Changed | $1,860 | -2.1% | $1 / Sq Ft | |
| 12/09/2020 12/09/20 | For Rent | $1,900 | +15.9% | -- | |
| 04/02/2019 04/02/19 | Rented | $1,640 | -0.3% | -- | |
| 03/25/2019 03/25/19 | Under Contract | -- | -- | -- | |
| 03/20/2019 03/20/19 | Price Changed | $1,645 | -0.9% | $1 / Sq Ft | |
| 03/06/2019 03/06/19 | For Rent | $1,660 | +9.9% | -- | |
| 02/07/2018 02/07/18 | Rented | $1,510 | 0.0% | -- | |
| 01/29/2018 01/29/18 | Under Contract | -- | -- | -- | |
| 01/22/2018 01/22/18 | For Rent | $1,510 | +4.2% | -- | |
| 02/27/2017 02/27/17 | Rented | $1,449 | 0.0% | -- | |
| 02/08/2017 02/08/17 | Under Contract | -- | -- | -- | |
| 01/16/2017 01/16/17 | Price Changed | $1,449 | -2.8% | $1 / Sq Ft | |
| 11/19/2016 11/19/16 | For Rent | $1,490 | 0.0% | -- | |
| 09/06/2016 09/06/16 | Sold | $173,000 | -7.7% | $68 / Sq Ft | View Prior Sale |
| 08/15/2016 08/15/16 | Pending | -- | -- | -- | |
| 08/10/2016 08/10/16 | Price Changed | $187,500 | -3.8% | $74 / Sq Ft | |
| 07/21/2016 07/21/16 | For Sale | $194,900 | -- | $77 / Sq Ft |
| Year | Tax Paid | Tax Assessment Tax Assessment Total Assessment is a certain percentage of the fair market value that is determined by local assessors to be the total taxable value of land and additions on the property. | Land | Improvement |
|---|---|---|---|---|
| 2024 | $5,287 | $140,400 | $28,800 | $111,600 |
| 2023 | $5,287 | $140,400 | $28,800 | $111,600 |
| 2022 | $3,554 | $151,440 | $28,800 | $122,640 |
| 2021 | $3,602 | $92,400 | $19,600 | $72,800 |
| 2020 | $3,623 | $92,400 | $19,600 | $72,800 |
| 2019 | $3,492 | $97,800 | $19,600 | $78,200 |
| 2018 | $3,197 | $83,920 | $15,600 | $68,320 |
| 2016 | $2,882 | $74,440 | $14,000 | $60,440 |
| 2015 | $2,582 | $65,000 | $12,400 | $52,600 |
| 2014 | $2,258 | $55,520 | $10,800 | $44,720 |
T
Landlord's Agent in 2023
Tanika Tanika Ford
Progress Residential Property Manager, LLC.
M
Seller's Agent in 2021
Marcy Edwards
NOT A VALID MEMBER
C
Seller's Agent in 2018
Celeste Schweizer
Method Real Estate Advisors
(404) 218-1899
2 Total Sales
R
Seller's Agent in 2017
Ross McTiernan
TAH Georgia, LLC

Seller's Agent in 2016
Ansley Willett
Southern Classic Realtors
(678) 628-9548
1 in this area
78 Total Sales
J
Buyer's Agent in 2016
Julie Budden
Ashton Woods Realty, LLC
Source: First Multiple Listing Service (FMLS)
MLS Number: 7212255
APN: 3-007-472
Disclaimer: Certain information contained herein is derived from information provided by parties other than Homes.com. All information provided is deemed reliable, but is not guaranteed to be accurate and should be independently verified.
![]() Listings identified with the FMLS IDX logo come from FMLS and are held by brokerage firms other than the owner of this website. The listing brokerage is identified in any listing details. Information is deemed reliable but is not guaranteed. If you believe any FMLS listing contains material that infringes your copyrighted work please visit www.fmls.com/dmca to review our DMCA policy and learn how to submit a takedown request. © 2025 First Multiple Listing Service, Inc.
Listings identified with the FMLS IDX logo come from FMLS and are held by brokerage firms other than the owner of this website. The listing brokerage is identified in any listing details. Information is deemed reliable but is not guaranteed. If you believe any FMLS listing contains material that infringes your copyrighted work please visit www.fmls.com/dmca to review our DMCA policy and learn how to submit a takedown request. © 2025 First Multiple Listing Service, Inc.