5210 Fishing Bridge Cheyenne, WY 82009
Estimated Value: $312,059 - $336,000
--
Bed
--
Bath
997
Sq Ft
$322/Sq Ft
Est. Value
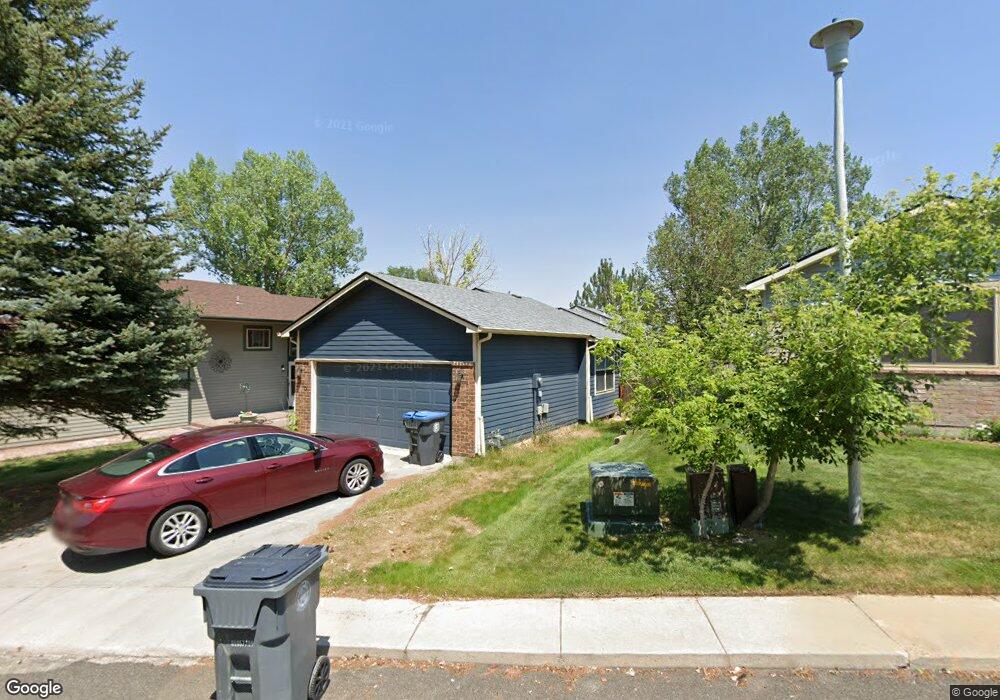
About This Home
This home is located at 5210 Fishing Bridge, Cheyenne, WY 82009 and is currently estimated at $321,265, approximately $322 per square foot. 5210 Fishing Bridge is a home located in Laramie County with nearby schools including Hobbs Elementary School, McCormick Junior High School, and Central High School.
Ownership History
Date
Name
Owned For
Owner Type
Purchase Details
Closed on
Apr 14, 2014
Sold by
Williams Debra J
Bought by
Williams Debra J
Current Estimated Value
Purchase Details
Closed on
May 10, 2012
Sold by
Williams Janet C
Bought by
Williams Janet C
Purchase Details
Closed on
Jul 6, 2011
Sold by
Williams Janet C
Bought by
Williams Janet C
Create a Home Valuation Report for This Property
The Home Valuation Report is an in-depth analysis detailing your home's value as well as a comparison with similar homes in the area
Home Values in the Area
Average Home Value in this Area
Purchase History
| Date | Buyer | Sale Price | Title Company |
|---|---|---|---|
| Williams Debra J | -- | None Available | |
| Williams Janet C | -- | None Available | |
| Williams Janet C | -- | None Available |
Source: Public Records
Tax History Compared to Growth
Tax History
| Year | Tax Paid | Tax Assessment Tax Assessment Total Assessment is a certain percentage of the fair market value that is determined by local assessors to be the total taxable value of land and additions on the property. | Land | Improvement |
|---|---|---|---|---|
| 2025 | $1,387 | $15,190 | $2,765 | $12,425 |
| 2024 | $1,387 | $19,617 | $3,687 | $15,930 |
| 2023 | $1,344 | $19,004 | $3,687 | $15,317 |
| 2022 | $1,308 | $18,118 | $3,687 | $14,431 |
| 2021 | $1,151 | $15,907 | $3,687 | $12,220 |
| 2020 | $1,120 | $15,530 | $3,687 | $11,843 |
| 2019 | $1,024 | $14,185 | $3,687 | $10,498 |
| 2018 | $935 | $13,079 | $3,374 | $9,705 |
| 2017 | $944 | $13,081 | $3,374 | $9,707 |
| 2016 | $862 | $11,933 | $3,251 | $8,682 |
| 2015 | $830 | $11,484 | $3,251 | $8,233 |
| 2014 | $815 | $11,205 | $3,251 | $7,954 |
Source: Public Records
Map
Nearby Homes
- 5211 Fishing Bridge
- 5211 Fawn Pass
- 249 Shoshoni St
- 5404 Sunset Dr
- 5413 Frederick Dr
- 5620 Sunset Dr
- 5711 Townsend Place
- 247 Miller Ln
- 706 Mylar Park Dr
- 234 Miller Ln Unit A
- 707 Arapaho St
- 722 Mylar Park Dr
- TBD E Carlson St
- 148 Kornegay Ct Unit 2
- 245 Lakeshore Dr
- 5907 Townsend Place
- 5120 Syracuse Rd
- 5503 Syracuse Rd
- 485 Andra Ct
- 945 Melton St
- 5224 Fishing Bridge
- 5206 Fishing Bridge
- 5202 Fishing Bridge
- 5270 Fishing Bridge
- 5268 Fishing Bridge
- 5272 Fishing Bridge
- 5215 Fishing Bridge
- 5335 Sunset Dr
- 5213 Fishing Bridge
- 5209 Fishing Bridge
- 5207 Fishing Bridge
- 5229 Fishing Bridge
- 5205 Fishing Bridge
- 5233 Fishing Bridge Unit 34
- 5225 Fishing Bridge
- 5225 Fishing Bridge Unit 23
- 5347 Sunset Dr
- 5223 Fishing Bridge
- 5235 Fishing Bridge
- 5274 Fishing Bridge