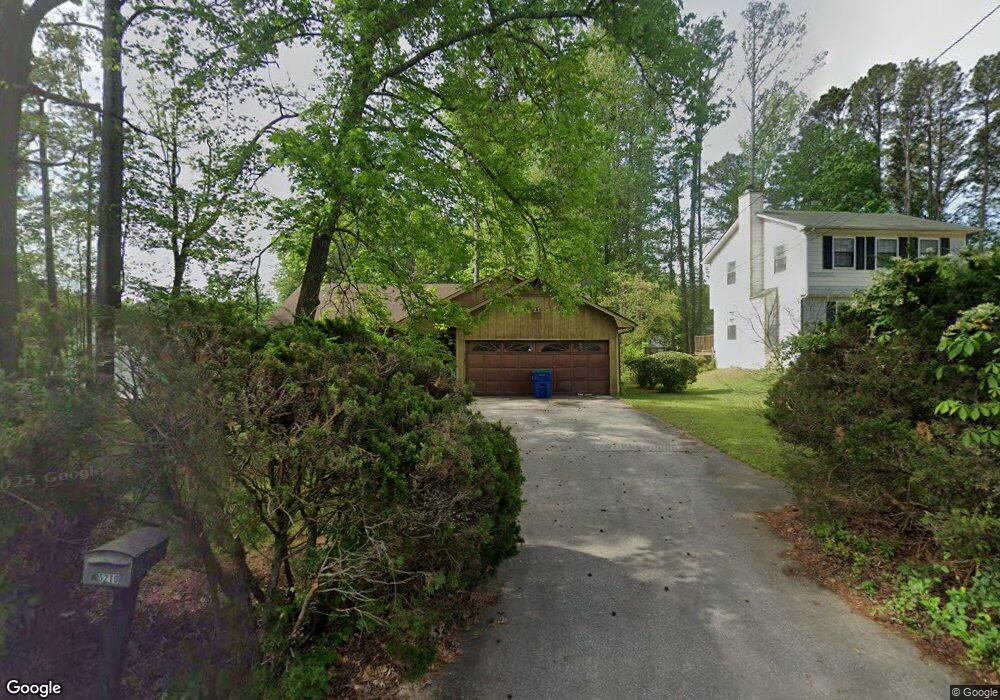
5210 Gladden Rd Fairburn, GA 30213
Estimated Value: $208,000 - $235,000
3
Beds
2
Baths
1,164
Sq Ft
$192/Sq Ft
Est. Value
About This Home
This home is located at 5210 Gladden Rd, Fairburn, GA 30213 and is currently estimated at $222,999, approximately $191 per square foot. 5210 Gladden Rd is a home located in Fulton County with nearby schools including Oakley Elementary School, Bear Creek Middle School, and Creekside High School.
Ownership History
Date
Name
Owned For
Owner Type
Purchase Details
Closed on
Oct 17, 2018
Bought by
Niamat Virani
Current Estimated Value
Home Financials for this Owner
Home Financials are based on the most recent Mortgage that was taken out on this home.
Original Mortgage
$537,588
Outstanding Balance
$472,737
Interest Rate
4.9%
Estimated Equity
-$249,738
Purchase Details
Closed on
Aug 26, 2002
Sold by
Williams April
Bought by
Strickland Otis
Home Financials for this Owner
Home Financials are based on the most recent Mortgage that was taken out on this home.
Original Mortgage
$94,760
Interest Rate
6.31%
Mortgage Type
VA
Purchase Details
Closed on
Dec 2, 1998
Sold by
Williams Frank M
Bought by
Williams April S
Purchase Details
Closed on
Nov 22, 1994
Sold by
Mellies Edwin W Sandra D
Bought by
Williams April
Home Financials for this Owner
Home Financials are based on the most recent Mortgage that was taken out on this home.
Original Mortgage
$62,168
Interest Rate
9.01%
Create a Home Valuation Report for This Property
The Home Valuation Report is an in-depth analysis detailing your home's value as well as a comparison with similar homes in the area
Home Values in the Area
Average Home Value in this Area
Purchase History
| Date | Buyer | Sale Price | Title Company |
|---|---|---|---|
| Niamat Virani | $672,000 | -- | |
| Strickland Otis | $92,000 | -- | |
| Williams April S | -- | -- | |
| Williams April | $63,500 | -- |
Source: Public Records
Mortgage History
| Date | Status | Borrower | Loan Amount |
|---|---|---|---|
| Open | Niamat Virani | $537,588 | |
| Closed | Niamat Virani | -- | |
| Previous Owner | Strickland Otis | $94,760 | |
| Previous Owner | Williams April | $62,168 |
Source: Public Records
Tax History Compared to Growth
Tax History
| Year | Tax Paid | Tax Assessment Tax Assessment Total Assessment is a certain percentage of the fair market value that is determined by local assessors to be the total taxable value of land and additions on the property. | Land | Improvement |
|---|---|---|---|---|
| 2025 | $2,142 | $94,440 | $20,560 | $73,880 |
| 2023 | $2,142 | $75,880 | $21,160 | $54,720 |
| 2022 | $1,636 | $57,960 | $10,680 | $47,280 |
| 2021 | $1,143 | $41,240 | $8,920 | $32,320 |
| 2020 | $1,143 | $40,480 | $8,840 | $31,640 |
| 2019 | $953 | $33,760 | $6,200 | $27,560 |
| 2018 | $930 | $32,960 | $6,040 | $26,920 |
| 2017 | $250 | $23,480 | $5,360 | $18,120 |
| 2016 | $249 | $23,480 | $5,360 | $18,120 |
| 2015 | $249 | $23,480 | $5,360 | $18,120 |
| 2014 | $55 | $12,960 | $2,960 | $10,000 |
Source: Public Records
Map
Nearby Homes
- 145 Town Ln
- 167 Fairhaven Trail
- 150 Fairhaven Trail
- 250 Woodside Blvd
- 390 Malibu Dr
- 395 Milam Rd
- 5315 Harris Rd
- 115 Browning Ct
- 0 Harris Rd Unit 10245444
- 105 New Castle Ln
- 0 Highway 74 N Unit 10510935
- 5526 Cosimo Rd
- Oakland Plan at Artisan Walk
- Jewel Plan at Artisan Walk
- 5522 Cosimo Rd
- 5528 Cosimo Rd
- 5530 Cosimo Rd
- 7754 Lance Rd
- 7753 Medieval St
- 310 Westbourne Dr
- 5220 Gladden Rd Unit 1
- 8371 Milam Loop
- 8367 Milam Loop
- 5230 Gladden Rd Unit 1
- 8375 Milam Loop
- 220 Gage Ct Unit 1
- 210 Gage Ct
- 5205 Gladden Rd Unit 1
- 8359 Milam Loop
- 5215 Gladden Rd
- 8379 Milam Loop
- 8310 Gledstone Way
- 5225 Gladden Rd
- 8355 Milam Loop
- 200 Gage Ct
- 8383 Milam Loop
- 230 Gage Ct
- 5235 Gladden Rd Unit 1
- 8368 Milam Loop
- 335 Galena Ct