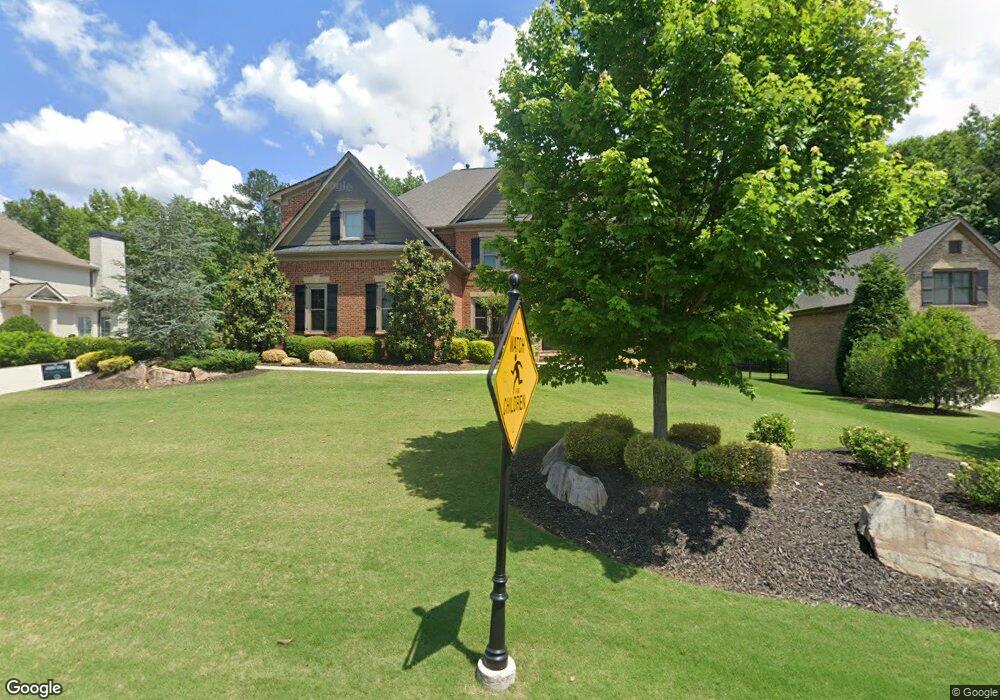
5210 Harris Springs Dr Unit 2 Cumming, GA 30040
Estimated Value: $1,218,000 - $1,562,289
5
Beds
6
Baths
4,487
Sq Ft
$307/Sq Ft
Est. Value
About This Home
This home is located at 5210 Harris Springs Dr Unit 2, Cumming, GA 30040 and is currently estimated at $1,378,572, approximately $307 per square foot. 5210 Harris Springs Dr Unit 2 is a home located in Forsyth County with nearby schools including Vickery Creek Middle School, West Forsyth High School, and Montessori School of Cumming.
Ownership History
Date
Name
Owned For
Owner Type
Purchase Details
Closed on
Dec 20, 2018
Sold by
Sutton James C
Bought by
Schonacher Brian Walter and Pugmire Annalisa
Current Estimated Value
Home Financials for this Owner
Home Financials are based on the most recent Mortgage that was taken out on this home.
Original Mortgage
$600,000
Interest Rate
4.8%
Mortgage Type
New Conventional
Purchase Details
Closed on
Jan 21, 2014
Sold by
Sutton James C
Bought by
Sutton James C and Sutton Mary K
Home Financials for this Owner
Home Financials are based on the most recent Mortgage that was taken out on this home.
Original Mortgage
$520,000
Interest Rate
2.63%
Mortgage Type
New Conventional
Purchase Details
Closed on
Mar 31, 2010
Sold by
Afb and Afb T
Bought by
Alex G Tetterton Homes Inc
Purchase Details
Closed on
Mar 3, 2009
Sold by
Osley Builders Inc
Bought by
Afb and Afb T
Create a Home Valuation Report for This Property
The Home Valuation Report is an in-depth analysis detailing your home's value as well as a comparison with similar homes in the area
Home Values in the Area
Average Home Value in this Area
Purchase History
| Date | Buyer | Sale Price | Title Company |
|---|---|---|---|
| Schonacher Brian Walter | $792,200 | -- | |
| Sutton James C | -- | -- | |
| Sutton James C | $650,000 | -- | |
| Sr Homes Llc | -- | -- | |
| Alex G Tetterton Homes Inc | $38,700 | -- | |
| Afb | $333,585 | -- |
Source: Public Records
Mortgage History
| Date | Status | Borrower | Loan Amount |
|---|---|---|---|
| Closed | Schonacher Brian Walter | $600,000 | |
| Previous Owner | Sr Homes Llc | $520,000 |
Source: Public Records
Tax History Compared to Growth
Tax History
| Year | Tax Paid | Tax Assessment Tax Assessment Total Assessment is a certain percentage of the fair market value that is determined by local assessors to be the total taxable value of land and additions on the property. | Land | Improvement |
|---|---|---|---|---|
| 2025 | $9,471 | $561,880 | $60,000 | $501,880 |
| 2024 | $9,471 | $386,216 | $338,216 | $48,000 |
| 2023 | $9,506 | $386,216 | $338,216 | $48,000 |
| 2022 | $8,737 | $306,504 | $44,000 | $262,504 |
| 2021 | $8,464 | $306,504 | $44,000 | $262,504 |
| 2020 | $7,166 | $259,516 | $44,000 | $215,516 |
| 2019 | $7,366 | $266,368 | $44,000 | $222,368 |
| 2018 | $7,000 | $253,140 | $44,000 | $209,140 |
| 2017 | $7,002 | $252,284 | $34,000 | $218,284 |
| 2016 | $7,002 | $252,284 | $34,000 | $218,284 |
| 2015 | $7,014 | $252,284 | $34,000 | $218,284 |
| 2014 | $6,107 | $230,676 | $0 | $0 |
Source: Public Records
Map
Nearby Homes
- 5265 Cole Creek Ln
- 5310 Cole Creek Ln
- 5420 Chestnut Dr
- 5450 Chestnut Dr
- 5430 Chestnut Dr
- 5620 Lilac Pass
- 3525 Elder Field Ln
- 5515 Cheatam Ave
- Turnberry Park Plan at The Parc at Post
- St. Ives Plan at The Parc at Post
- Heritage Manor Plan at The Parc at Post
- Chatham Place Plan at The Parc at Post
- 3595 Moor Pointe Dr
- 5640 Copper Creek Pass
- 5740 Zelkova Dr
- 5605 Copper Creek Pass
- 5065 Reserve Dr
- 5245 Wilshire Crossing
- 5364 Post Rd
- 5820 Zelkova Dr
- 5210 Harris Springs Dr
- 5215 Harris Springs Dr
- 5130 Harris Springs Dr Unit 1
- 5130 Harris Springs Dr
- 5220 Harris Springs Dr
- 5215 Cole Creek Ln
- 5094 Post Rd
- 5225 Harris Springs Dr
- 5225 Harris Springs Dr Unit 65
- 5220 Cole Creek Ln
- 5084 Post Rd
- 5235 Harris Springs Dr
- 5230 Cole Creek Ln
- 5240 Harris Springs Dr
- 5149 Post Rd
- 5520 Ballybandon Ct
- 3505 Harris Springs Dr
- 5250 Harris Springs Dr
- 5255 Harris Springs Dr