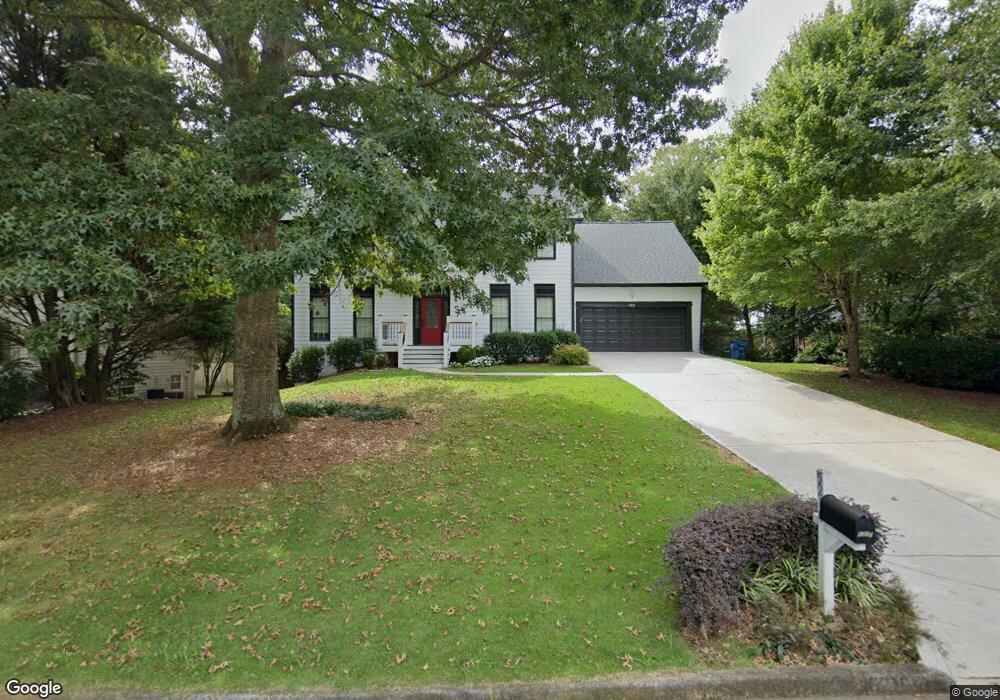
5210 Hunters Oaks Dr Alpharetta, GA 30009
Estimated Value: $719,000 - $838,000
4
Beds
3
Baths
2,656
Sq Ft
$301/Sq Ft
Est. Value
About This Home
This home is located at 5210 Hunters Oaks Dr, Alpharetta, GA 30009 and is currently estimated at $798,417, approximately $300 per square foot. 5210 Hunters Oaks Dr is a home located in Fulton County with nearby schools including Alpharetta Elementary School, Northwestern Middle School, and Milton High School.
Ownership History
Date
Name
Owned For
Owner Type
Purchase Details
Closed on
Jul 15, 2014
Sold by
Berzas Laura
Bought by
Clark Laura K
Current Estimated Value
Purchase Details
Closed on
Jul 27, 2007
Sold by
White John M and White Brittany C
Bought by
Berzas Noel and Berzas Laura
Home Financials for this Owner
Home Financials are based on the most recent Mortgage that was taken out on this home.
Original Mortgage
$306,400
Interest Rate
6.65%
Mortgage Type
New Conventional
Purchase Details
Closed on
Jul 22, 2003
Sold by
Bertsch Michael A and Bertsch Debra S
Bought by
White John M and White Brittany
Home Financials for this Owner
Home Financials are based on the most recent Mortgage that was taken out on this home.
Original Mortgage
$261,182
Interest Rate
5.52%
Purchase Details
Closed on
Mar 29, 1996
Sold by
Mason Daryl Rhonda
Bought by
Bertsch Michael A Debra S
Create a Home Valuation Report for This Property
The Home Valuation Report is an in-depth analysis detailing your home's value as well as a comparison with similar homes in the area
Home Values in the Area
Average Home Value in this Area
Purchase History
| Date | Buyer | Sale Price | Title Company |
|---|---|---|---|
| Clark Laura K | -- | -- | |
| Berzas Noel | $383,000 | -- | |
| White John M | $260,000 | -- | |
| Bertsch Michael A Debra S | $196,000 | -- |
Source: Public Records
Mortgage History
| Date | Status | Borrower | Loan Amount |
|---|---|---|---|
| Previous Owner | Berzas Noel | $306,400 | |
| Previous Owner | White John M | $261,182 | |
| Closed | Bertsch Michael A Debra S | $0 |
Source: Public Records
Tax History Compared to Growth
Tax History
| Year | Tax Paid | Tax Assessment Tax Assessment Total Assessment is a certain percentage of the fair market value that is determined by local assessors to be the total taxable value of land and additions on the property. | Land | Improvement |
|---|---|---|---|---|
| 2025 | $673 | $377,320 | $35,080 | $342,240 |
| 2023 | $7,497 | $265,600 | $35,080 | $230,520 |
| 2022 | $3,167 | $265,600 | $35,080 | $230,520 |
| 2021 | $3,741 | $212,480 | $41,080 | $171,400 |
| 2020 | $3,735 | $186,000 | $29,320 | $156,680 |
| 2019 | $580 | $186,000 | $29,320 | $156,680 |
| 2018 | $3,026 | $211,040 | $29,320 | $181,720 |
| 2017 | $3,481 | $119,320 | $21,040 | $98,280 |
| 2016 | $3,482 | $119,320 | $21,040 | $98,280 |
| 2015 | $4,182 | $119,320 | $21,040 | $98,280 |
| 2014 | $3,267 | $119,320 | $21,040 | $98,280 |
Source: Public Records
Map
Nearby Homes
- Hillstone with Basement Plan at Emberly - Monarch Collection
- Rockmart Elite Plan at Emberly - Mariposa Collection
- Rockmart Plan at Emberly - Mariposa Collection
- Hedgewood with Basement Plan at Emberly - Monarch Collection
- Hedgewood Plan at Emberly - Monarch Collection
- Hillstone Plan at Emberly - Monarch Collection
- Rockmart Grand Plan at Emberly - Mariposa Collection
- Antoinette with Basement Plan at Emberly - Monarch Collection
- Antoinette Plan at Emberly - Monarch Collection
- 1614 Rucker Rd
- 1810 Broadwell Oaks Dr
- 417 Lynne Cir
- 1530 Rucker Rd
- 3016 Steeplechase Unit 3
- 3018 Steeplechase
- 3052 Steeplechase
- 3058 Steeplechase Unit 4
- 355 Heritage Ln Unit 1
- 326 Treble Way
- 362 Mayfield Cir
- 5220 Hunters Oaks Dr
- 5200 Hunters Oaks Dr
- 5205 Hunters Oaks Dr
- 5230 Hunters Oaks Dr
- 5225 Hunters Oaks Dr
- 5235 Hunters Oaks Dr
- 8011 Oak Land Ln
- 160 Wills Rd Unit 1
- 5240 Hunters Oaks Dr Unit 1
- 150 Wills Rd
- 170 Wills Rd
- 8010 Oak Land Ln
- 5245 Hunters Oaks Dr
- 140 Wills Rd
- 180 Wills Rd Unit 1
- 5250 Hunters Oaks Dr
- 8021 Oak Land Ln
- 8020 Oak Land Ln Unit 400
- 190 Wills Rd
- 130 Wills Rd