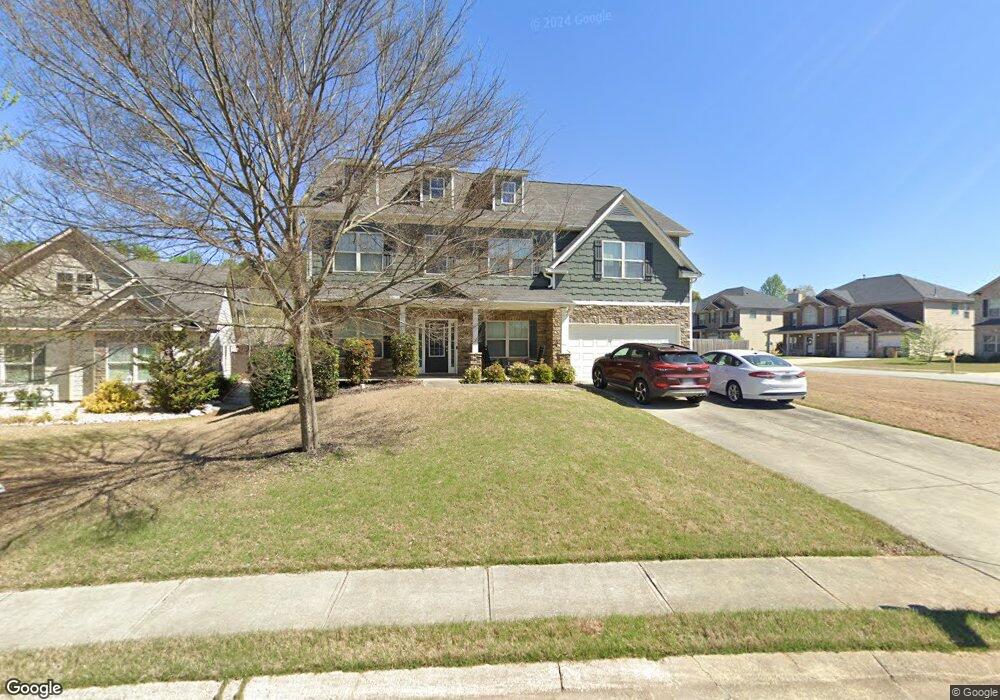
5210 Mundy Ct Unit 189 Cumming, GA 30028
Estimated Value: $544,000 - $577,000
4
Beds
3
Baths
3,916
Sq Ft
$143/Sq Ft
Est. Value
About This Home
This home is located at 5210 Mundy Ct Unit 189, Cumming, GA 30028 and is currently estimated at $560,555, approximately $143 per square foot. 5210 Mundy Ct Unit 189 is a home located in Forsyth County with nearby schools including Silver City Elementary School, North Forsyth Middle School, and North Forsyth High School.
Ownership History
Date
Name
Owned For
Owner Type
Purchase Details
Closed on
Feb 29, 2016
Sold by
Larson Troy E
Bought by
Shepard Stephen
Current Estimated Value
Home Financials for this Owner
Home Financials are based on the most recent Mortgage that was taken out on this home.
Original Mortgage
$278,856
Outstanding Balance
$221,444
Interest Rate
3.75%
Mortgage Type
FHA
Estimated Equity
$339,111
Purchase Details
Closed on
Mar 28, 2014
Sold by
Bk Residential Constructio
Bought by
Larson Troy E and Larson Jennifer G
Home Financials for this Owner
Home Financials are based on the most recent Mortgage that was taken out on this home.
Original Mortgage
$261,395
Interest Rate
4.12%
Mortgage Type
FHA
Purchase Details
Closed on
Jul 19, 2013
Sold by
Forsyth Hopewell Partners
Bought by
Bk Residential Construction Ll
Create a Home Valuation Report for This Property
The Home Valuation Report is an in-depth analysis detailing your home's value as well as a comparison with similar homes in the area
Home Values in the Area
Average Home Value in this Area
Purchase History
| Date | Buyer | Sale Price | Title Company |
|---|---|---|---|
| Shepard Stephen | $284,000 | -- | |
| Larson Troy E | $266,247 | -- | |
| Bk Residential Construction Ll | $93,000 | -- |
Source: Public Records
Mortgage History
| Date | Status | Borrower | Loan Amount |
|---|---|---|---|
| Open | Shepard Stephen | $278,856 | |
| Previous Owner | Larson Troy E | $261,395 |
Source: Public Records
Tax History Compared to Growth
Tax History
| Year | Tax Paid | Tax Assessment Tax Assessment Total Assessment is a certain percentage of the fair market value that is determined by local assessors to be the total taxable value of land and additions on the property. | Land | Improvement |
|---|---|---|---|---|
| 2025 | $4,735 | $213,616 | $54,000 | $159,616 |
| 2024 | $4,735 | $229,324 | $50,000 | $179,324 |
| 2023 | $4,074 | $211,176 | $38,000 | $173,176 |
| 2022 | $4,032 | $138,792 | $30,000 | $108,792 |
| 2021 | $3,610 | $138,792 | $30,000 | $108,792 |
| 2020 | $3,429 | $130,052 | $18,000 | $112,052 |
| 2019 | $3,390 | $127,912 | $18,000 | $109,912 |
| 2018 | $3,307 | $123,692 | $18,000 | $105,692 |
| 2017 | $3,065 | $113,600 | $16,200 | $97,400 |
| 2016 | $2,865 | $106,368 | $15,200 | $91,168 |
| 2015 | $2,870 | $106,368 | $15,200 | $91,168 |
| 2014 | -- | $58,648 | $12,800 | $45,848 |
Source: Public Records
Map
Nearby Homes
- 5315 Hopewell Manor Dr
- 5030 Mundy Dr
- 5270 Mundy Ct
- 5340 Mundy Ct
- 4810 Hopewell Manor Dr
- 5260 Birch Valley Rd
- 5375 Julep Ct
- 5240 Birch Valley Rd
- 5405 Julep Ct
- 5415 Julep Ct
- 5210 Birch Valley Rd
- 5260 Fieldgate Ridge Dr
- 5415 Fieldfreen Dr
- 5040 Fieldstone Bend Dr Unit 1
- 4720 Montane St
- 4730 Montane St
- Shelby Plan at Hopewell Reserve
- Emerson Plan at Hopewell Reserve
- Canton II Plan at Hopewell Reserve
- Riverside Plan at Hopewell Reserve
- 5210 Mundy Ct
- 5220 Mundy Ct
- 5230 Mundy Ct
- 5225 Mundy Ct
- 5345 Rob Ct
- 5335 Rob Ct
- 5325 Rob Ct
- 5180 Mundy Ct
- 5240 Mundy Ct
- 5235 Mundy Ct Unit 192
- 5235 Mundy Ct
- 5315 Rob Ct
- 5315 Rob Ct Unit 9
- 5325 Hopewell Manor Dr
- 5345 Hopewell Manor Dr
- 5170 Mundy Ct
- 5250 Mundy Ct
- 5245 Mundy Ct
- 5355 Hopewell Manor Dr
- 5365 Hopewell Manor Dr 0