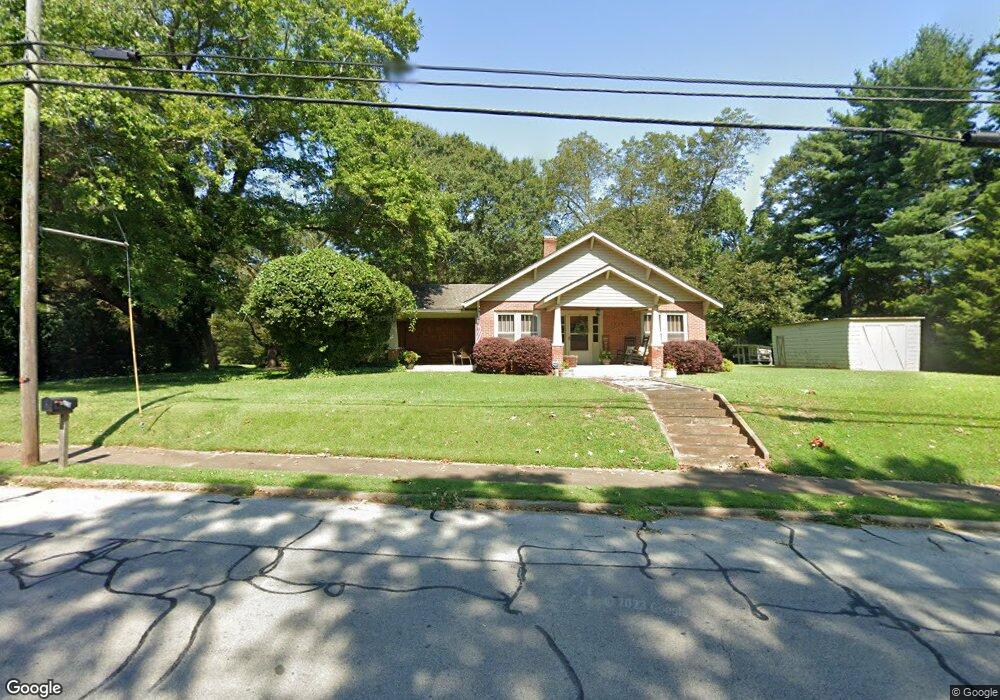
5210 Vickery St Lavonia, GA 30553
Estimated Value: $217,000 - $251,000
2
Beds
1
Bath
1,564
Sq Ft
$148/Sq Ft
Est. Value
About This Home
This home is located at 5210 Vickery St, Lavonia, GA 30553 and is currently estimated at $231,697, approximately $148 per square foot. 5210 Vickery St is a home with nearby schools including Franklin County High School.
Ownership History
Date
Name
Owned For
Owner Type
Purchase Details
Closed on
Oct 5, 2021
Sold by
Gunter Todd
Bought by
Garvin Douglas Stuart and Garvin Shelly Leigh
Current Estimated Value
Home Financials for this Owner
Home Financials are based on the most recent Mortgage that was taken out on this home.
Original Mortgage
$198,484
Outstanding Balance
$180,999
Interest Rate
2.8%
Mortgage Type
New Conventional
Estimated Equity
$50,698
Purchase Details
Closed on
Mar 5, 2021
Sold by
Big Dawg Resources Llc
Bought by
Gunter Todd
Purchase Details
Closed on
May 10, 2018
Sold by
T T Gunter Properties Llc
Bought by
Big Dawg Resources Llc
Purchase Details
Closed on
May 1, 2015
Sold by
Beall Goerge E
Bought by
Tt Gunter Properties Llc
Purchase Details
Closed on
May 18, 2007
Sold by
Not Provided
Bought by
Beall Goerge E
Purchase Details
Closed on
May 17, 2007
Sold by
Not Provided
Bought by
Beall Goerge E
Purchase Details
Closed on
May 15, 2007
Sold by
Beall Wilma B
Bought by
Beall George E
Purchase Details
Closed on
Jul 20, 2001
Sold by
Smith Ethelyn B
Bought by
Beall Wilma B
Create a Home Valuation Report for This Property
The Home Valuation Report is an in-depth analysis detailing your home's value as well as a comparison with similar homes in the area
Home Values in the Area
Average Home Value in this Area
Purchase History
| Date | Buyer | Sale Price | Title Company |
|---|---|---|---|
| Garvin Douglas Stuart | $196,500 | -- | |
| Gunter Todd | -- | -- | |
| Big Dawg Resources Llc | -- | -- | |
| Tt Gunter Properties Llc | $42,000 | -- | |
| Beall Goerge E | -- | -- | |
| Beall Goerge E | -- | -- | |
| Beall George E | -- | -- | |
| Beall Wilma B | -- | -- |
Source: Public Records
Mortgage History
| Date | Status | Borrower | Loan Amount |
|---|---|---|---|
| Open | Garvin Douglas Stuart | $198,484 |
Source: Public Records
Tax History Compared to Growth
Tax History
| Year | Tax Paid | Tax Assessment Tax Assessment Total Assessment is a certain percentage of the fair market value that is determined by local assessors to be the total taxable value of land and additions on the property. | Land | Improvement |
|---|---|---|---|---|
| 2024 | $2,443 | $75,196 | $10,560 | $64,636 |
| 2023 | $2,435 | $69,320 | $10,560 | $58,760 |
| 2022 | $2,296 | $63,966 | $10,560 | $53,406 |
| 2021 | $1,420 | $44,640 | $7,200 | $37,440 |
| 2020 | $1,198 | $31,536 | $7,200 | $24,336 |
| 2019 | $1,400 | $37,776 | $7,200 | $30,576 |
| 2018 | $1,138 | $30,587 | $7,200 | $23,387 |
| 2017 | $630 | $16,432 | $7,200 | $9,232 |
| 2016 | $718 | $17,806 | $7,200 | $10,606 |
| 2015 | -- | $25,003 | $7,200 | $17,804 |
| 2014 | -- | $25,004 | $7,200 | $17,804 |
| 2013 | -- | $25,003 | $7,200 | $17,803 |
Source: Public Records
Map
Nearby Homes
- 5474 Vickery St
- 5494 Vickery St
- 45 Wright St Unit 64
- 57 Wright St Unit 68
- 55 Wright St Unit 67
- 51 Wright St Unit 66
- 49 Wright St Unit 65
- 5710 Vickery St
- 89 Huntington Dr
- 59 Wright St Unit 69
- 353 Bow Dr
- 0 Highway 59 Unit 10615036
- 90 Old City Park Rd
- 138 Victoria Ln
- 86 Luckie St
- 103 Ross Place
- 266 Randall St
- 104 Powers Rd
- 0 Hwy 59 and Ross Place Unit 10499138
- 3434 Highway 59
- 5215 Vickery St
- 5240 Vickery St
- 5245 Vickery St
- 5160 Vickery St
- 5155 Vickery St
- 5275 Vickery St
- 50 First St
- 5136 Vickery St
- 5291 Vickery St
- 101 Washington St
- 5131 Vickery St
- #1 Georgia 59
- 84 Washington St
- 11 First St
- 5116 Vickery St
- 5351 Vickery St
- 100 Washington St
- 123 First St
- 72 Washington St
- 5355 Vickery St