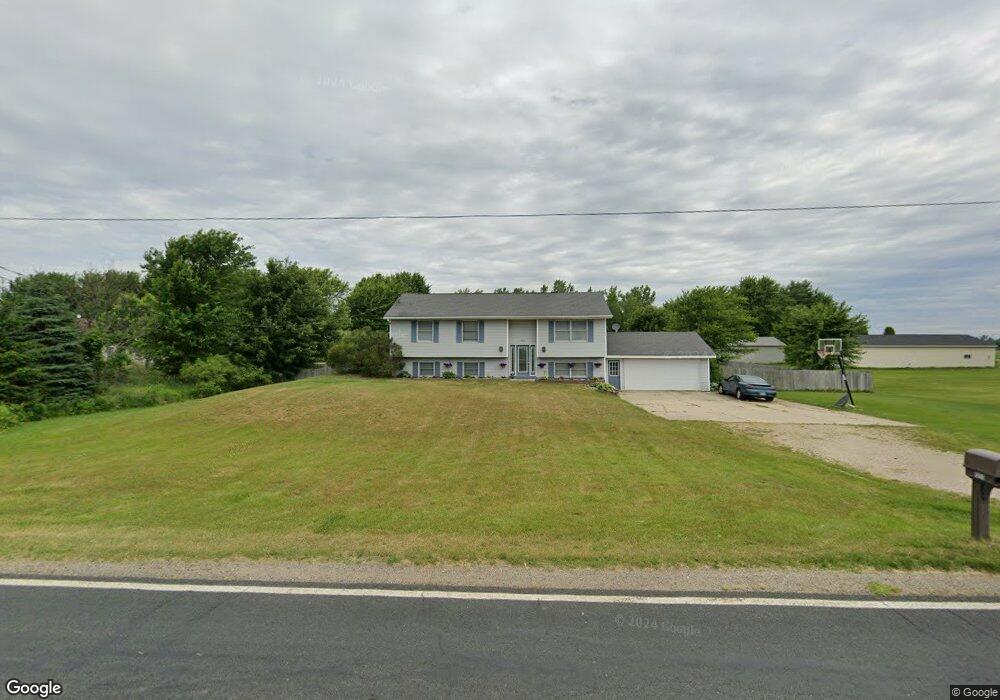
5211 141st Ave Holland, MI 49423
Estimated Value: $234,000 - $374,000
--
Bed
--
Bath
1,400
Sq Ft
$227/Sq Ft
Est. Value
About This Home
This home is located at 5211 141st Ave, Holland, MI 49423 and is currently estimated at $317,578, approximately $226 per square foot. 5211 141st Ave is a home located in Allegan County with nearby schools including Hamilton High School.
Ownership History
Date
Name
Owned For
Owner Type
Purchase Details
Closed on
Apr 30, 2020
Sold by
Weller Kathy and Howard Brian
Bought by
Weller Kathy
Current Estimated Value
Home Financials for this Owner
Home Financials are based on the most recent Mortgage that was taken out on this home.
Original Mortgage
$152,000
Outstanding Balance
$134,693
Interest Rate
3.3%
Mortgage Type
New Conventional
Estimated Equity
$182,885
Purchase Details
Closed on
Nov 17, 2006
Sold by
Reinink Timothy A and Reinink Kathy
Bought by
Weller Kathy and Howard Brian
Home Financials for this Owner
Home Financials are based on the most recent Mortgage that was taken out on this home.
Original Mortgage
$179,350
Interest Rate
6.41%
Mortgage Type
FHA
Purchase Details
Closed on
Jun 19, 1998
Sold by
Howard Kathy-Reinink Tim
Bought by
Reinink Timothy and Reinink Kathy
Purchase Details
Closed on
Apr 24, 1997
Sold by
Stango Michael A and Stango Sandra
Bought by
Howard Kathy-Reinink Timothy
Create a Home Valuation Report for This Property
The Home Valuation Report is an in-depth analysis detailing your home's value as well as a comparison with similar homes in the area
Home Values in the Area
Average Home Value in this Area
Purchase History
| Date | Buyer | Sale Price | Title Company |
|---|---|---|---|
| Weller Kathy | -- | Servicelink | |
| Weller Kathy | -- | Customer One Title | |
| Reinink Timothy A | -- | Title Pro Agency | |
| Reinink Timothy | -- | -- | |
| Howard Kathy-Reinink Timothy | $127,000 | -- |
Source: Public Records
Mortgage History
| Date | Status | Borrower | Loan Amount |
|---|---|---|---|
| Open | Weller Kathy | $152,000 | |
| Closed | Reinink Timothy A | $179,350 | |
| Closed | Reinink Timothy A | $181,239 |
Source: Public Records
Tax History Compared to Growth
Tax History
| Year | Tax Paid | Tax Assessment Tax Assessment Total Assessment is a certain percentage of the fair market value that is determined by local assessors to be the total taxable value of land and additions on the property. | Land | Improvement |
|---|---|---|---|---|
| 2025 | $2,472 | $132,200 | $16,300 | $115,900 |
| 2024 | -- | $124,800 | $14,200 | $110,600 |
| 2023 | $2,253 | $111,100 | $13,800 | $97,300 |
| 2022 | $2,099 | $103,800 | $13,800 | $90,000 |
| 2021 | $2,169 | $91,100 | $91,100 | $0 |
| 2020 | $2,136 | $91,100 | $91,100 | $0 |
| 2019 | $2,083 | $0 | $0 | $0 |
| 2018 | $0 | $91,100 | $91,100 | $0 |
| 2017 | $0 | $91,100 | $91,100 | $0 |
| 2016 | $0 | $0 | $0 | $0 |
| 2015 | -- | $66,800 | $66,800 | $0 |
| 2014 | -- | $66,800 | $66,800 | $0 |
| 2013 | -- | $62,400 | $62,400 | $0 |
Source: Public Records
Map
Nearby Homes
- 980 Lincoln Rd
- 355 E 64th St
- 730 E 64th St
- 0 Waverly Rd
- 5014 136th Ave
- 4667 52nd St
- 5569 136th Ave
- 5216 Mulberry Ln
- 3560 Woodfield Ct
- 3619 Diamond Dr
- 5232 E Sunfield Ln
- 4812 Green Meadow Ct
- VL Ottogan St
- 970 Sagewood Ct Unit 4
- Lot 17 Peppermint Dr
- Lot 15 Peppermint Dr
- Lot 16 Peppermint Dr
- 421 E 32nd St
- Lot 17 of Peppermint Dr
- 3559 Lincoln Rd