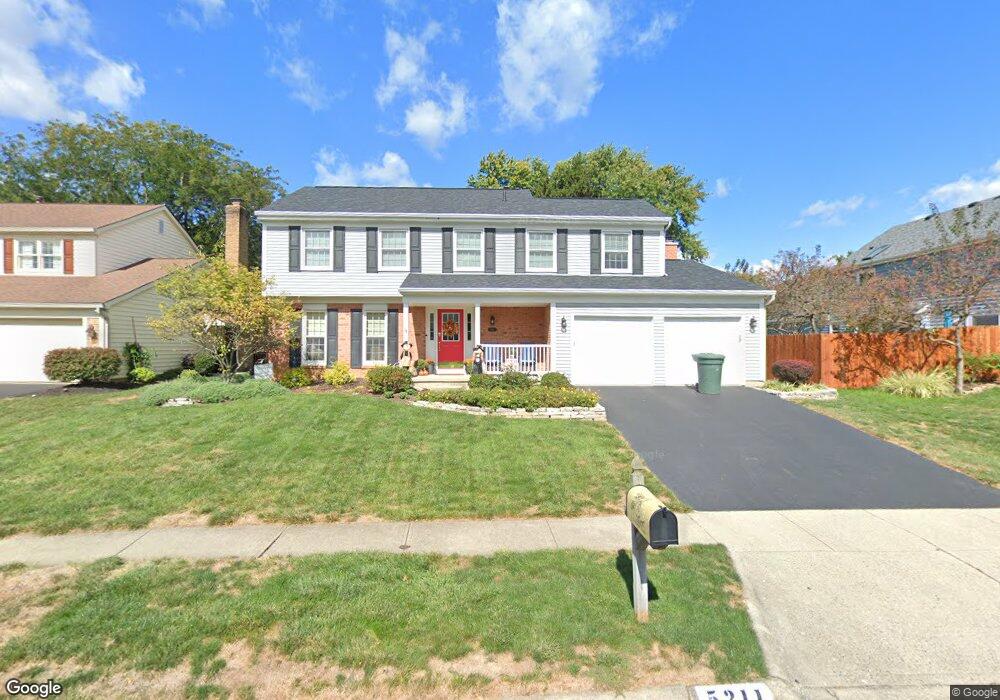
5211 Dory Ln Columbus, OH 43235
The Gables NeighborhoodEstimated Value: $460,000 - $520,000
4
Beds
3
Baths
2,196
Sq Ft
$221/Sq Ft
Est. Value
About This Home
This home is located at 5211 Dory Ln, Columbus, OH 43235 and is currently estimated at $484,472, approximately $220 per square foot. 5211 Dory Ln is a home located in Franklin County with nearby schools including Gables Elementary School, Ridgeview Middle School, and Centennial High School.
Ownership History
Date
Name
Owned For
Owner Type
Purchase Details
Closed on
Nov 18, 2005
Sold by
Strong Jeffrey A
Bought by
Kent Kelly D
Current Estimated Value
Purchase Details
Closed on
Aug 15, 2002
Sold by
Kanner Dale S
Bought by
Strong Jeffrey A and Kent Kelly D
Home Financials for this Owner
Home Financials are based on the most recent Mortgage that was taken out on this home.
Original Mortgage
$165,700
Interest Rate
6.56%
Mortgage Type
Purchase Money Mortgage
Purchase Details
Closed on
May 13, 2002
Sold by
Kanner Sonia M
Bought by
Kanner Dale S
Home Financials for this Owner
Home Financials are based on the most recent Mortgage that was taken out on this home.
Original Mortgage
$150,400
Interest Rate
7%
Purchase Details
Closed on
Jun 26, 1992
Bought by
Kanner Dale S and Kanner Sonia M
Purchase Details
Closed on
May 1, 1985
Purchase Details
Closed on
Dec 1, 1984
Create a Home Valuation Report for This Property
The Home Valuation Report is an in-depth analysis detailing your home's value as well as a comparison with similar homes in the area
Home Values in the Area
Average Home Value in this Area
Purchase History
| Date | Buyer | Sale Price | Title Company |
|---|---|---|---|
| Kent Kelly D | -- | -- | |
| Strong Jeffrey A | $195,000 | Title First Agency Inc | |
| Kanner Dale S | -- | Discovery Title Agency Inc | |
| Kanner Dale S | $143,500 | -- | |
| -- | $108,600 | -- | |
| -- | -- | -- |
Source: Public Records
Mortgage History
| Date | Status | Borrower | Loan Amount |
|---|---|---|---|
| Previous Owner | Strong Jeffrey A | $165,700 | |
| Previous Owner | Kanner Dale S | $150,400 |
Source: Public Records
Tax History
| Year | Tax Paid | Tax Assessment Tax Assessment Total Assessment is a certain percentage of the fair market value that is determined by local assessors to be the total taxable value of land and additions on the property. | Land | Improvement |
|---|---|---|---|---|
| 2025 | $8,705 | $143,930 | $45,680 | $98,250 |
| 2024 | $8,705 | $143,930 | $45,680 | $98,250 |
| 2023 | $8,583 | $143,920 | $45,675 | $98,245 |
| 2022 | $7,389 | $115,160 | $31,540 | $83,620 |
| 2021 | $7,509 | $115,160 | $31,540 | $83,620 |
| 2020 | $7,464 | $115,160 | $31,540 | $83,620 |
| 2019 | $7,109 | $97,100 | $26,290 | $70,810 |
| 2018 | $6,475 | $97,100 | $26,290 | $70,810 |
| 2017 | $6,563 | $97,100 | $26,290 | $70,810 |
| 2016 | $5,778 | $80,300 | $17,890 | $62,410 |
| 2015 | $5,814 | $80,300 | $17,890 | $62,410 |
| 2014 | $5,820 | $80,300 | $17,890 | $62,410 |
| 2013 | $2,814 | $76,475 | $17,045 | $59,430 |
Source: Public Records
Map
Nearby Homes
- 1138 Slade Ave
- 1221 Bethel Rd
- 5118 Dalmeny Ct Unit 5118
- 5520 Ellinger St
- 1566 Lorraine Ave
- 5315 Portland St Unit 201
- 5285 Portland St Unit 204
- 5275 Portland St Unit 202
- 913 White Willow Ln Unit 913
- 4944 Buck Thorn Ln
- 962 Augusta Glen Dr
- 1558 Denbigh Dr
- 1683 Saint Albans Ct Unit 22-83
- 5354 Shannon Ln Unit 71
- 5348 Shannon Ln Unit 68
- 1466 Weybridge Rd
- 5108 Ranstead Ct
- 4818 Winterset Dr Unit 820
- 4710 Charecote Ln Unit D
- 5936 Aqua Bay Dr
- 5203 Dory Ln
- 1281 Nantucket Ave
- 5265 Dory Ln
- 5208 Dory Ln
- 1289 Nantucket Ave
- 1263 Nantucket Ave
- 5255 Dory Ln
- 5266 Dory Ln
- 5248 Dory Ln
- 1297 Nantucket Ave
- 5254 Dory Ln
- 1305 Nantucket Ave
- 1251 Nantucket Ave
- 1282 Nantucket Ave
- 1313 Nantucket Ave
- 1296 Slade Ave
- 1288 Nantucket Ave
- 5255 Cape Cod Ln
- 1276 Nantucket Ave
- 1272 Slade Ave
Your Personal Tour Guide
Ask me questions while you tour the home.