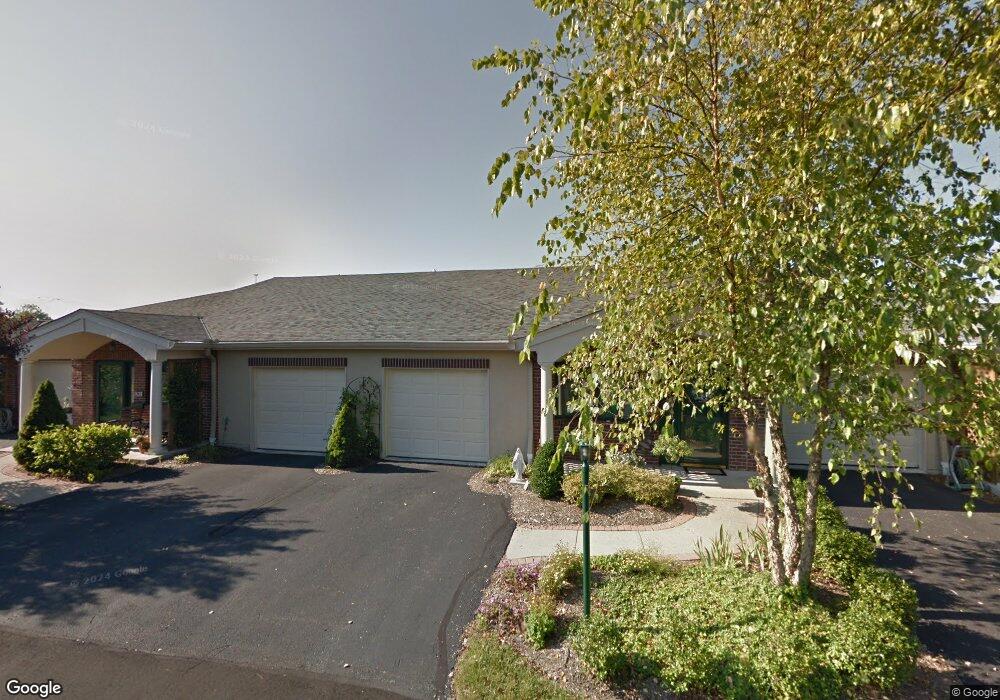
5211 N Bend Crossing Cincinnati, OH 45247
West Monfort Heights NeighborhoodEstimated Value: $203,270 - $225,000
2
Beds
2
Baths
1,252
Sq Ft
$172/Sq Ft
Est. Value
About This Home
This home is located at 5211 N Bend Crossing, Cincinnati, OH 45247 and is currently estimated at $215,818, approximately $172 per square foot. 5211 N Bend Crossing is a home located in Hamilton County with nearby schools including Monfort Heights Elementary School, White Oak Middle School, and Colerain High School.
Ownership History
Date
Name
Owned For
Owner Type
Purchase Details
Closed on
Mar 28, 2012
Sold by
Cahall Jean C
Bought by
Cahall Jean Claire and Jean Claire Cahall Living Trust
Current Estimated Value
Purchase Details
Closed on
May 27, 2011
Sold by
Newsom Elza G
Bought by
Cahall Hobert and The Cahall Living Trust
Home Financials for this Owner
Home Financials are based on the most recent Mortgage that was taken out on this home.
Original Mortgage
$87,850
Outstanding Balance
$61,071
Interest Rate
4.81%
Mortgage Type
New Conventional
Estimated Equity
$154,747
Purchase Details
Closed on
May 12, 2005
Sold by
Newsom Richard A and Newsom Margaret A
Bought by
Newsom Elza G
Purchase Details
Closed on
May 9, 2005
Sold by
Newsom Marie J and Newsom Elza G
Bought by
Newsom Elza G
Purchase Details
Closed on
Jan 9, 2004
Sold by
Banks Philomena A Harpring and Banks Thomas
Bought by
Newsom Elza G and Newsom Marie J
Purchase Details
Closed on
Dec 7, 2001
Sold by
S/Nbl Associates
Bought by
Harpring Philomena A
Create a Home Valuation Report for This Property
The Home Valuation Report is an in-depth analysis detailing your home's value as well as a comparison with similar homes in the area
Home Values in the Area
Average Home Value in this Area
Purchase History
| Date | Buyer | Sale Price | Title Company |
|---|---|---|---|
| Cahall Jean Claire | -- | None Available | |
| Cahall Hobert | $117,300 | Attorney | |
| Newsom Elza G | -- | None Available | |
| Newsom Elza G | -- | None Available | |
| Newsom Elza G | $140,000 | -- | |
| Harpring Philomena A | $135,100 | -- |
Source: Public Records
Mortgage History
| Date | Status | Borrower | Loan Amount |
|---|---|---|---|
| Open | Cahall Hobert | $87,850 |
Source: Public Records
Tax History Compared to Growth
Tax History
| Year | Tax Paid | Tax Assessment Tax Assessment Total Assessment is a certain percentage of the fair market value that is determined by local assessors to be the total taxable value of land and additions on the property. | Land | Improvement |
|---|---|---|---|---|
| 2024 | $2,612 | $59,364 | $10,325 | $49,039 |
| 2023 | $2,668 | $59,364 | $10,325 | $49,039 |
| 2022 | $2,067 | $40,520 | $8,012 | $32,508 |
| 2021 | $1,885 | $40,520 | $8,012 | $32,508 |
| 2020 | $1,916 | $40,520 | $8,012 | $32,508 |
| 2019 | $1,889 | $37,174 | $7,350 | $29,824 |
| 2018 | $1,682 | $37,174 | $7,350 | $29,824 |
| 2017 | $1,583 | $37,174 | $7,350 | $29,824 |
| 2016 | $1,519 | $35,718 | $6,395 | $29,323 |
| 2015 | $1,540 | $35,718 | $6,395 | $29,323 |
| 2014 | $1,543 | $35,718 | $6,395 | $29,323 |
| 2013 | $1,729 | $41,055 | $7,350 | $33,705 |
Source: Public Records
Map
Nearby Homes
- 5440 Asbury Lake Dr
- 3775 Boomer Rd
- 5476 Audro Dr
- 4491 W Fork Rd
- 4201 Boomer Rd
- 3731 Ridgedale Dr
- 5538 Silverpoint Dr
- The McPherson Plan at Ivy Rose - Designer Collection
- Carrington Plan at Ivy Rose - Designer Collection
- Winston Plan at Ivy Rose - Designer Collection
- Calvin Plan at Ivy Rose - Designer Collection
- Miles Plan at Ivy Rose - Designer Collection
- Blair Plan at Ivy Rose - Designer Collection
- Magnolia Plan at Ivy Rose - Designer Collection
- Grandin Plan at Ivy Rose - Designer Collection
- Wyatt Plan at Ivy Rose - Designer Collection
- Avery Plan at Ivy Rose - Designer Collection
- Charles Plan at Ivy Rose - Designer Collection
- 4575 Boomer Rd
- 4628 Boomer Rd
- 5211 Northbend Crossing Unit 77
- 5215 Northbend Crossing Unit 75
- 5241 Northbend Crossing Unit 7A
- 5213 Northbend Crossing Unit 6
- 5247 Northbend Crossing Unit 74
- 5247 N Bend Crossing
- 5243 N Bend Crossing
- 5215 N Bend Crossing
- 5245 N Bend Crossing
- 5245 Northbend Crossing Unit 73
- 5203 Northbend Crossing Unit 83
- 5243 Northbend Crossing Unit 72
- 5177 Northbend Crossing Unit 114
- 5175 N Bend Crossing
- 5251 N Bend Crossing
- 5201 Northbend Crossing
- 5253 Northbend Crossing Unit 82
- 5251 Northbend Crossing Unit 81
- 5201 N Bend Crossing
- 5203 N Bend Crossing