Estimated Value: $64,000 - $372,000
1
Bed
1
Bath
400
Sq Ft
$614/Sq Ft
Est. Value
About This Home
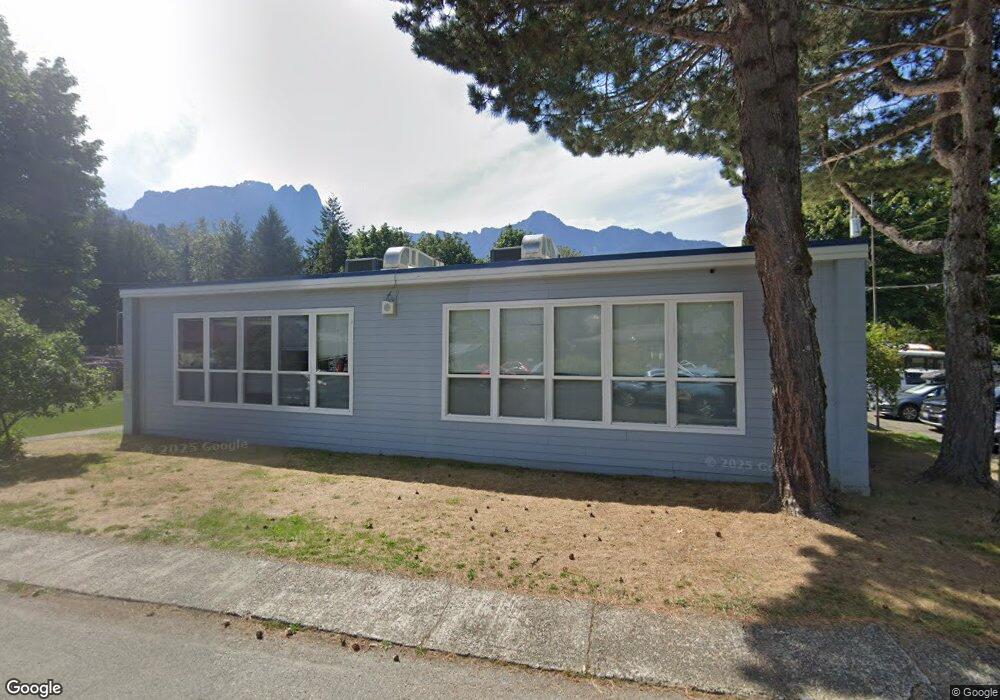
This home is located at 52116 Yunkas Rd, Index, WA 98256 and is currently estimated at $245,657, approximately $614 per square foot. 52116 Yunkas Rd is a home located in Snohomish County with nearby schools including Index Elementary School.
Ownership History
Date
Name
Owned For
Owner Type
Purchase Details
Closed on
Jan 18, 2018
Sold by
Harding Alyssa and Harding Drek
Bought by
Remaly Edward and Wood Suzanne
Current Estimated Value
Home Financials for this Owner
Home Financials are based on the most recent Mortgage that was taken out on this home.
Original Mortgage
$35,000
Outstanding Balance
$29,536
Interest Rate
3.94%
Mortgage Type
Commercial
Estimated Equity
$216,121
Purchase Details
Closed on
Apr 11, 2016
Sold by
Vize Sharp Todd A
Bought by
Harding Derek and Harding Alyssa
Purchase Details
Closed on
May 1, 2015
Sold by
Vize Sharp Todd A
Bought by
Harding Derek and Harding Alyssa
Purchase Details
Closed on
Jan 12, 2010
Sold by
Harding Derek and Harding Alyssa
Bought by
Vize Sharp Todd A
Home Financials for this Owner
Home Financials are based on the most recent Mortgage that was taken out on this home.
Original Mortgage
$73,777
Interest Rate
4.78%
Mortgage Type
Seller Take Back
Purchase Details
Closed on
Jun 17, 2004
Sold by
Graham Diana L
Bought by
Harding Derek and Harding Alyssa
Create a Home Valuation Report for This Property
The Home Valuation Report is an in-depth analysis detailing your home's value as well as a comparison with similar homes in the area
Home Values in the Area
Average Home Value in this Area
Purchase History
| Date | Buyer | Sale Price | Title Company |
|---|---|---|---|
| Remaly Edward | $40,000 | None Available | |
| Harding Derek | $32,500 | None Available | |
| Harding Derek | $32,500 | None Available | |
| Vize Sharp Todd A | $78,777 | Pacific Northwest Title Co | |
| Harding Derek | $4,000 | Chicago Title |
Source: Public Records
Mortgage History
| Date | Status | Borrower | Loan Amount |
|---|---|---|---|
| Open | Remaly Edward | $35,000 | |
| Previous Owner | Vize Sharp Todd A | $73,777 |
Source: Public Records
Tax History Compared to Growth
Tax History
| Year | Tax Paid | Tax Assessment Tax Assessment Total Assessment is a certain percentage of the fair market value that is determined by local assessors to be the total taxable value of land and additions on the property. | Land | Improvement |
|---|---|---|---|---|
| 2025 | $603 | $116,800 | $94,800 | $22,000 |
| 2024 | $603 | $67,100 | $45,000 | $22,100 |
| 2023 | $705 | $91,600 | $57,000 | $34,600 |
| 2022 | $668 | $70,500 | $42,000 | $28,500 |
| 2020 | $528 | $49,700 | $29,000 | $20,700 |
| 2019 | $493 | $47,900 | $18,500 | $29,400 |
| 2018 | $645 | $55,000 | $25,000 | $30,000 |
| 2017 | $669 | $59,400 | $32,000 | $27,400 |
| 2016 | $659 | $56,200 | $27,000 | $29,200 |
| 2015 | $258 | $22,500 | $10,800 | $11,700 |
| 2013 | $495 | $43,500 | $21,500 | $22,000 |
Source: Public Records
Map
Nearby Homes
- 52123 S Riverside Rd
- 52305 Stahmer Place S
- 51223 195th Place SE
- 0 State Route 2
- 201 7th St
- 7 XX Index Ave
- 0 Index Ave Unit NWM2395640
- 0 Index Ave Unit NWM2395613
- 49122 U S 2
- 63428 NE 196th St
- 0 NE 194th Place
- 0 U S Highway 2
- 63631 194th Place NE
- 0 NE Index Creek Rd Unit NWM2443015
- 18242 643rd Ave NE Unit 54
- 0 Index Galina Rd
- 64455 180th St NE
- 15305 Index-Galena Rd
- 44331 Pine Rd
- 44222 179th Place SE
- 52112 Yunkus Place
- 52106 Yunkas Rd
- 52106 Yunkus Place
- 52124 S Riverside Rd
- 279 lot S Riverside Rd
- 278 lot S Riverside Rd
- 51526 S Riverside Rd
- 52632 S Riverside Rd
- 52812 S Riverside Rd
- 0 S Riverside Rd
- 52202 S Riverside Rd
- 51607 S Riverside Rd
- 52916 S Riverside Rd
- 52016 S Riverside Rd
- 52103 S Riverside Rd
- 52113 S Riverside Rd
- 52027 S Riverside Rd
- 52119 S Riverside Rd
- 52133 S Riverside Rd
- 52127 S Riverside Rd