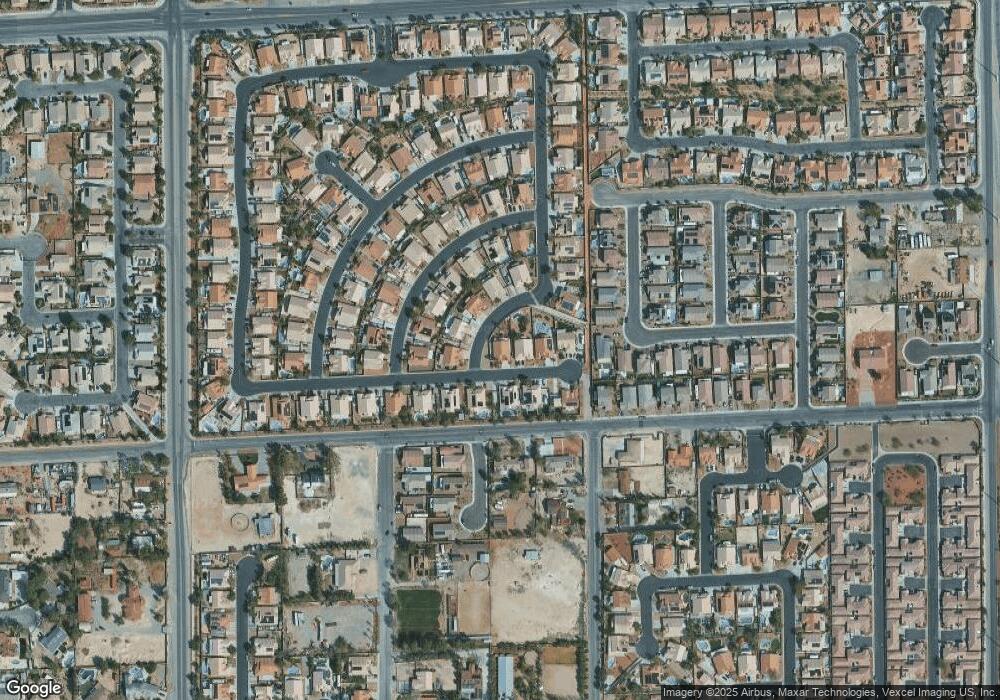
5212 Black Coral Ave Unit 1 Las Vegas, NV 89131
Tule Springs NeighborhoodEstimated Value: $538,979 - $642,000
3
Beds
3
Baths
2,372
Sq Ft
$250/Sq Ft
Est. Value
About This Home
This home is located at 5212 Black Coral Ave Unit 1, Las Vegas, NV 89131 and is currently estimated at $592,995, approximately $249 per square foot. 5212 Black Coral Ave Unit 1 is a home located in Clark County with nearby schools including Kay Carl Elementary School, Anthony Saville Middle School, and Shadow Ridge High School.
Ownership History
Date
Name
Owned For
Owner Type
Purchase Details
Closed on
Mar 4, 2017
Sold by
Chaffin Edward and Chaffin Kuisoon
Bought by
Chaffin Edward E and Chaffin Kuisoomn
Current Estimated Value
Purchase Details
Closed on
Apr 29, 2003
Sold by
D R Horton Inc
Bought by
Chaffin Edward and Chaffin Kuisoon
Home Financials for this Owner
Home Financials are based on the most recent Mortgage that was taken out on this home.
Original Mortgage
$60,000
Interest Rate
5.72%
Create a Home Valuation Report for This Property
The Home Valuation Report is an in-depth analysis detailing your home's value as well as a comparison with similar homes in the area
Home Values in the Area
Average Home Value in this Area
Purchase History
| Date | Buyer | Sale Price | Title Company |
|---|---|---|---|
| Chaffin Edward E | -- | None Available | |
| Chaffin Edward | $259,610 | United Title Of Nevada |
Source: Public Records
Mortgage History
| Date | Status | Borrower | Loan Amount |
|---|---|---|---|
| Closed | Chaffin Edward | $60,000 |
Source: Public Records
Tax History Compared to Growth
Tax History
| Year | Tax Paid | Tax Assessment Tax Assessment Total Assessment is a certain percentage of the fair market value that is determined by local assessors to be the total taxable value of land and additions on the property. | Land | Improvement |
|---|---|---|---|---|
| 2025 | $2,784 | $140,050 | $42,700 | $97,350 |
| 2024 | $2,703 | $140,050 | $42,700 | $97,350 |
| 2023 | $2,703 | $138,951 | $46,900 | $92,051 |
| 2022 | $2,630 | $119,769 | $35,700 | $84,069 |
| 2021 | $2,651 | $112,376 | $32,550 | $79,826 |
| 2020 | $2,571 | $111,515 | $32,550 | $78,965 |
| 2019 | $2,405 | $106,840 | $29,050 | $77,790 |
| 2018 | $2,335 | $100,263 | $25,550 | $74,713 |
| 2017 | $3,115 | $97,662 | $22,050 | $75,612 |
| 2016 | $2,210 | $91,290 | $18,900 | $72,390 |
| 2015 | $2,207 | $74,133 | $15,400 | $58,733 |
| 2014 | $2,141 | $72,340 | $12,250 | $60,090 |
Source: Public Records
Map
Nearby Homes
- 7000 Wild Wave Dr
- 6951 Cinder Crow Ct
- 6985 Unicorn St
- 5637 Dorrell Ln
- 6945 Unicorn St
- 5353 Dorrell Ln
- 6925 Unicorn St
- 6920 Bradley Rd
- 7157 Painted Paradise St
- 4920 Encore Paradise Ave
- 4804 Harmonize Ct
- 7038 Silver Palace St
- 5400 Mello Ave
- 7324 Savannah Falls St
- 7348 Zion Falls St
- 7230 N Decatur Blvd Unit 6
- 5714 Kings Bluff Ave
- 5721 Kings Bluff Ave
- 7308 N Decatur Blvd Unit 1
- 7308 N Decatur Blvd Unit 6
- 5208 Black Coral Ave
- 7021 Ocean Sea Dr Unit 1
- 7031 Ocean Sea Dr
- 7011 Ocean Sea Dr
- 5209 Black Coral Ave Unit 1
- 7041 Ocean Sea Dr
- 5213 Black Coral Ave
- 5205 Black Coral Ave
- 5200 Black Coral Ave
- 7051 Ocean Sea Dr Unit 1
- 5217 Black Coral Ave
- 7028 Red Tide Dr
- 7014 Red Tide Dr Unit 1
- 5201 Black Coral Ave
- 7042 Red Tide Dr Unit 1
- 7050 Sea Orchard St
- 7000 Red Tide Dr
- 7056 Red Tide Dr Unit 1
- 7070 Red Tide Dr Unit 1
- 5221 Black Coral Ave
