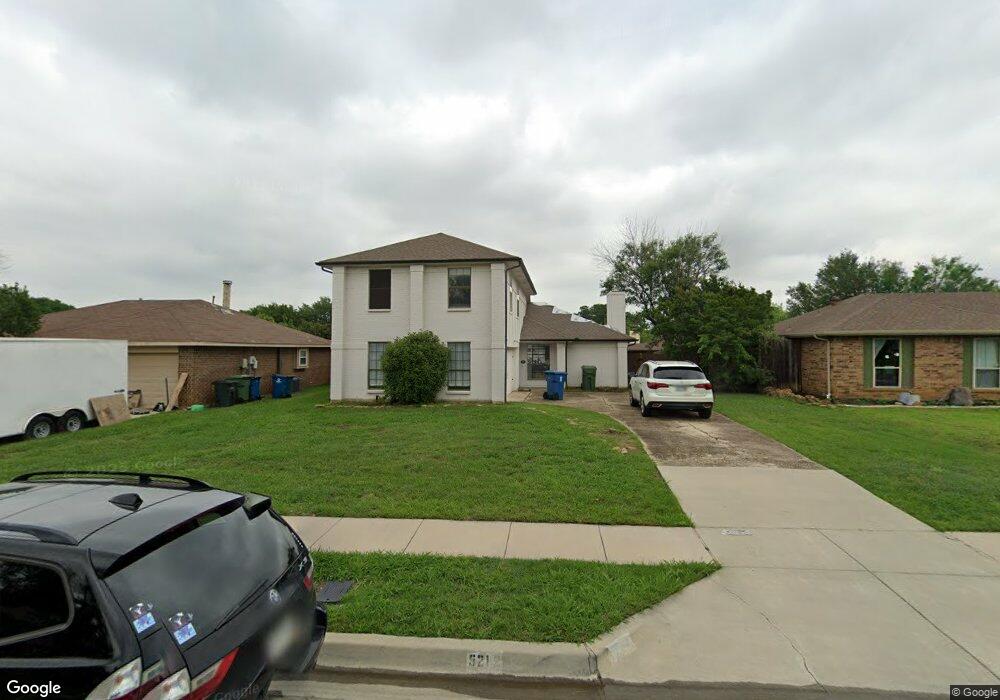
5212 Colonial Dr Flower Mound, TX 75028
Prairie Creek NeighborhoodEstimated Value: $393,000 - $426,000
--
Bed
3
Baths
1,990
Sq Ft
$204/Sq Ft
Est. Value
About This Home
This home is located at 5212 Colonial Dr, Flower Mound, TX 75028 and is currently estimated at $406,366, approximately $204 per square foot. 5212 Colonial Dr is a home located in Denton County with nearby schools including Prairie Trail Elementary School, Lamar Middle School, and Marcus High School.
Ownership History
Date
Name
Owned For
Owner Type
Purchase Details
Closed on
Jan 13, 2017
Sold by
Davis Candace Caryle
Bought by
Davis Candace Caryle and Candace Davis Trust
Current Estimated Value
Purchase Details
Closed on
Feb 25, 2005
Sold by
Friendly Family #1 Lp
Bought by
Davis Candace Caryle
Home Financials for this Owner
Home Financials are based on the most recent Mortgage that was taken out on this home.
Original Mortgage
$102,400
Outstanding Balance
$52,395
Interest Rate
5.75%
Mortgage Type
Purchase Money Mortgage
Estimated Equity
$353,971
Purchase Details
Closed on
Jan 1, 1998
Sold by
Peterson Arthur W
Bought by
The Friendly Family #1 Ltd Partnership
Purchase Details
Closed on
Jan 27, 1997
Sold by
Hud
Bought by
Peterson Arthur W
Purchase Details
Closed on
Jul 2, 1996
Sold by
Jenkins David S and Jenkins Sandra L
Bought by
Midfirst Bank
Create a Home Valuation Report for This Property
The Home Valuation Report is an in-depth analysis detailing your home's value as well as a comparison with similar homes in the area
Home Values in the Area
Average Home Value in this Area
Purchase History
| Date | Buyer | Sale Price | Title Company |
|---|---|---|---|
| Davis Candace Caryle | -- | None Available | |
| Davis Candace Caryle | -- | Fnt | |
| The Friendly Family #1 Ltd Partnership | -- | -- | |
| Peterson Arthur W | -- | Safeco Land Title | |
| Midfirst Bank | $83,635 | -- |
Source: Public Records
Mortgage History
| Date | Status | Borrower | Loan Amount |
|---|---|---|---|
| Open | Davis Candace Caryle | $102,400 |
Source: Public Records
Tax History Compared to Growth
Tax History
| Year | Tax Paid | Tax Assessment Tax Assessment Total Assessment is a certain percentage of the fair market value that is determined by local assessors to be the total taxable value of land and additions on the property. | Land | Improvement |
|---|---|---|---|---|
| 2025 | $6,738 | $384,160 | $86,912 | $297,248 |
| 2024 | $6,738 | $398,000 | $86,912 | $311,088 |
| 2023 | $3,926 | $230,000 | $86,912 | $143,088 |
| 2022 | $4,091 | $220,000 | $72,944 | $147,056 |
| 2021 | $4,959 | $246,845 | $44,698 | $202,147 |
| 2020 | $5,318 | $266,000 | $49,664 | $216,336 |
| 2019 | $5,056 | $244,000 | $49,664 | $194,336 |
| 2018 | $4,377 | $210,000 | $49,664 | $160,336 |
| 2017 | $4,215 | $200,000 | $49,664 | $150,336 |
| 2016 | $4,548 | $215,809 | $49,664 | $166,145 |
| 2015 | $3,414 | $156,000 | $33,862 | $122,138 |
| 2013 | -- | $156,000 | $33,862 | $122,138 |
Source: Public Records
Map
Nearby Homes
- 5329 Ponder Place
- 1208 Homestead St
- 5400 Carriage Ct
- 5309 Buckner Dr
- 1105 Coker Dr
- 4925 Marcus Dr
- 1617 Oak Creek Dr
- 1204 Marcus Ct
- 1554 N Valley Pkwy
- 1682 Shannon Dr
- 1602 Autumn Breeze Ln
- 1661 Crosshaven Dr
- 5324 Peterson Ct
- 1613 Autumn Breeze Ln
- 1601 Autumn Breeze Ln
- 1534 Autumn Breeze Ln
- 1845 Tiburon Bend
- 593 King Cir
- 1837 Meyerwood Ln N
- 1581 Glenmore Dr
- 5216 Colonial Dr
- 5208 Colonial Dr
- 1324 Colony Ct
- 1320 Colony Ct
- 5204 Colonial Dr
- 5220 Colonial Dr
- 1325 Ponder Way
- 5213 Colonial Dr
- 1321 Colony Ct
- 5209 Colonial Dr
- 5217 Colonial Dr
- 5205 Colonial Dr
- 1316 Colony Ct
- 1328 Homestead St
- 5221 Colonial Dr
- 1324 Homestead St
- 1319 Colony Ct
- 1317 Ponder Way
- 5300 Colonial Dr
- 1320 Homestead St