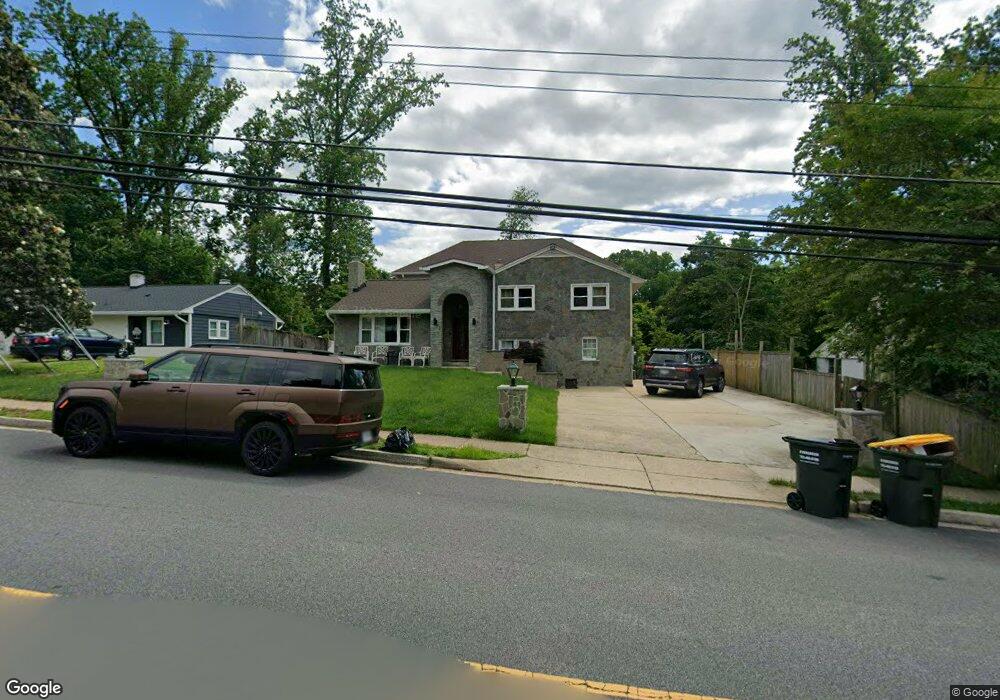
5212 Ferndale St Springfield, VA 22151
Estimated Value: $775,000 - $1,070,000
3
Beds
2
Baths
1,247
Sq Ft
$775/Sq Ft
Est. Value
About This Home
This home is located at 5212 Ferndale St, Springfield, VA 22151 and is currently estimated at $965,812, approximately $774 per square foot. 5212 Ferndale St is a home located in Fairfax County with nearby schools including North Springfield Elementary School, Holmes Middle School, and Annandale High School.
Ownership History
Date
Name
Owned For
Owner Type
Purchase Details
Closed on
Mar 23, 2016
Sold by
Abuelhawa Khalil
Bought by
Hawa Rami Abu El
Current Estimated Value
Home Financials for this Owner
Home Financials are based on the most recent Mortgage that was taken out on this home.
Original Mortgage
$305,400
Outstanding Balance
$183,719
Interest Rate
3.62%
Mortgage Type
New Conventional
Estimated Equity
$782,093
Purchase Details
Closed on
Mar 26, 2010
Sold by
Abu El Hawa Shadi Khalil
Bought by
Abuelhawa Khalil and Abuelhawa Mohammad K
Home Financials for this Owner
Home Financials are based on the most recent Mortgage that was taken out on this home.
Original Mortgage
$324,022
Interest Rate
5.02%
Mortgage Type
FHA
Purchase Details
Closed on
Aug 15, 2006
Sold by
Truong Kevin Thao
Bought by
Hawa Shadi Khalil A
Home Financials for this Owner
Home Financials are based on the most recent Mortgage that was taken out on this home.
Original Mortgage
$417,600
Interest Rate
6.88%
Mortgage Type
New Conventional
Purchase Details
Closed on
Oct 21, 1996
Sold by
Loewenstein Peter J
Bought by
Truong Nhung T
Home Financials for this Owner
Home Financials are based on the most recent Mortgage that was taken out on this home.
Original Mortgage
$153,000
Interest Rate
8.26%
Create a Home Valuation Report for This Property
The Home Valuation Report is an in-depth analysis detailing your home's value as well as a comparison with similar homes in the area
Home Values in the Area
Average Home Value in this Area
Purchase History
| Date | Buyer | Sale Price | Title Company |
|---|---|---|---|
| Hawa Rami Abu El | -- | None Available | |
| Abuelhawa Khalil | $330,000 | -- | |
| Hawa Shadi Khalil A | $522,000 | -- | |
| Truong Nhung T | $170,000 | -- |
Source: Public Records
Mortgage History
| Date | Status | Borrower | Loan Amount |
|---|---|---|---|
| Open | Hawa Rami Abu El | $305,400 | |
| Previous Owner | Abuelhawa Khalil | $324,022 | |
| Previous Owner | Hawa Shadi Khalil A | $417,600 | |
| Previous Owner | Truong Nhung T | $153,000 |
Source: Public Records
Tax History
| Year | Tax Paid | Tax Assessment Tax Assessment Total Assessment is a certain percentage of the fair market value that is determined by local assessors to be the total taxable value of land and additions on the property. | Land | Improvement |
|---|---|---|---|---|
| 2025 | $10,150 | $921,630 | $281,000 | $640,630 |
| 2024 | $10,150 | $876,120 | $266,000 | $610,120 |
| 2023 | $9,648 | $854,910 | $256,000 | $598,910 |
| 2022 | $9,394 | $821,550 | $226,000 | $595,550 |
| 2021 | $9,035 | $769,950 | $208,000 | $561,950 |
| 2020 | $8,296 | $700,940 | $208,000 | $492,940 |
| 2019 | $8,296 | $700,940 | $208,000 | $492,940 |
| 2018 | $7,546 | $656,130 | $208,000 | $448,130 |
| 2017 | $7,327 | $631,080 | $196,000 | $435,080 |
| 2016 | $7,195 | $621,080 | $186,000 | $435,080 |
| 2015 | $6,734 | $603,410 | $181,000 | $422,410 |
| 2014 | $4,504 | $404,450 | $177,000 | $227,450 |
Source: Public Records
Map
Nearby Homes
- 7314 Inzer St
- 7313 Byrneley Ln
- 5401 Ferndale St
- 7331 Calvert St
- 5502 Atlee Place
- 7005 Leestone St
- 7112 Dalhouse St
- 7403 Carmine St
- 4917 Erie St
- 4700 Backlick Rd
- 6726 Bostwick Dr
- 7209 Sipes Ln
- 7207 Evanston Rd
- 7727 Kalorama Rd
- 7227 Evanston Rd
- 5213 Montgomery St
- 6728 Hopewell Ave
- 7269 Evanston Rd
- 7052 Wardell St
- 7113 Falcon St
- 5210 Ferndale St
- 5214 Ferndale St
- 5207 Easton Dr
- 5209 Easton Dr
- 5208 Ferndale St
- 5205 Easton Dr
- 5211 Ferndale St
- 5216 Ferndale St
- 5211 Easton Dr
- 5203 Easton Dr
- 5213 Ferndale St
- 5207 Ferndale St
- 5218 Ferndale St
- 7303 Inzer St
- 5213 Easton Dr
- 7302 Inzer St
- 5201 Easton Dr
- 7302 Hogarth St
- 5204 Ferndale St
- 5210 Easton Dr
Your Personal Tour Guide
Ask me questions while you tour the home.