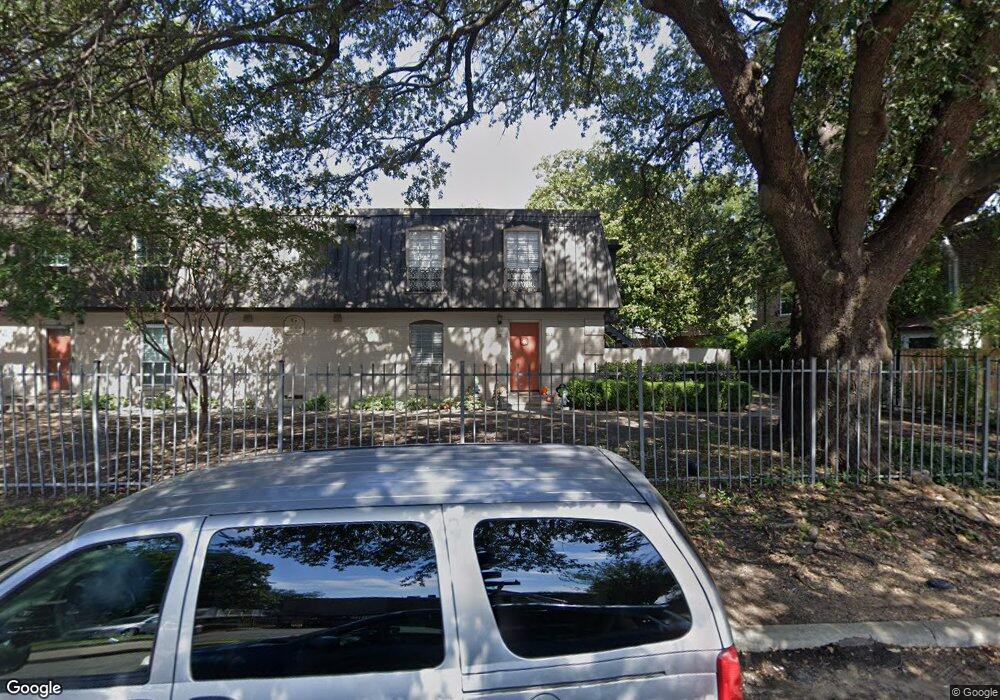
5212 Fleetwood Oaks Ave Unit 101G Dallas, TX 75235
Southwestern Medical District NeighborhoodEstimated Value: $140,569 - $152,000
1
Bed
1
Bath
710
Sq Ft
$205/Sq Ft
Est. Value
About This Home
This home is located at 5212 Fleetwood Oaks Ave Unit 101G, Dallas, TX 75235 and is currently estimated at $145,892, approximately $205 per square foot. 5212 Fleetwood Oaks Ave Unit 101G is a home located in Dallas County with nearby schools including Maple Lawn Elementary School, Thomas J. Rusk Middle School, and North Dallas High School.
Ownership History
Date
Name
Owned For
Owner Type
Purchase Details
Closed on
Aug 9, 2021
Sold by
Wilmore David E and Colbert Kenneth T
Bought by
Hoedebeck Charles E
Current Estimated Value
Purchase Details
Closed on
Sep 18, 2017
Sold by
Dynasty Property Id 3 Llc
Bought by
Wilmore David E and Hoedebeck Charles E
Home Financials for this Owner
Home Financials are based on the most recent Mortgage that was taken out on this home.
Original Mortgage
$88,000
Interest Rate
3.93%
Mortgage Type
Commercial
Purchase Details
Closed on
Feb 15, 2017
Sold by
Dynasty Alpha Llc
Bought by
Dynasty Property Id 3 Llc
Purchase Details
Closed on
Mar 21, 2016
Sold by
Harris Cynthia L and Corder Cynthia
Bought by
Dynasty Alpha Llc
Purchase Details
Closed on
Dec 3, 2007
Sold by
Coyle Grady E
Bought by
Crow Brynn L
Home Financials for this Owner
Home Financials are based on the most recent Mortgage that was taken out on this home.
Original Mortgage
$40,850
Interest Rate
6.4%
Mortgage Type
Purchase Money Mortgage
Create a Home Valuation Report for This Property
The Home Valuation Report is an in-depth analysis detailing your home's value as well as a comparison with similar homes in the area
Home Values in the Area
Average Home Value in this Area
Purchase History
| Date | Buyer | Sale Price | Title Company |
|---|---|---|---|
| Hoedebeck Charles E | -- | Providence Title Company | |
| Wilmore David E | -- | None Available | |
| Dynasty Property Id 3 Llc | -- | Chicago Title | |
| Dynasty Alpha Llc | -- | Attorney | |
| Crow Brynn L | -- | Hftc |
Source: Public Records
Mortgage History
| Date | Status | Borrower | Loan Amount |
|---|---|---|---|
| Previous Owner | Wilmore David E | $88,000 | |
| Previous Owner | Crow Brynn L | $40,850 |
Source: Public Records
Tax History Compared to Growth
Tax History
| Year | Tax Paid | Tax Assessment Tax Assessment Total Assessment is a certain percentage of the fair market value that is determined by local assessors to be the total taxable value of land and additions on the property. | Land | Improvement |
|---|---|---|---|---|
| 2025 | $2,915 | $130,420 | $42,360 | $88,060 |
| 2024 | $2,915 | $130,420 | $42,360 | $88,060 |
| 2023 | $2,915 | $124,250 | $42,360 | $81,890 |
| 2022 | $3,107 | $124,250 | $42,360 | $81,890 |
| 2021 | $2,809 | $106,500 | $42,360 | $64,140 |
| 2020 | $2,889 | $106,500 | $42,360 | $64,140 |
| 2019 | $3,030 | $106,500 | $42,360 | $64,140 |
| 2018 | $2,857 | $105,080 | $26,620 | $78,460 |
| 2017 | $2,703 | $99,400 | $26,620 | $72,780 |
| 2016 | $2,606 | $95,850 | $24,200 | $71,650 |
| 2015 | $1,374 | $67,450 | $6,050 | $61,400 |
| 2014 | $1,374 | $67,450 | $6,050 | $61,400 |
Source: Public Records
Map
Nearby Homes
- 5214 Fleetwood Oaks Ave Unit 206
- 5226 Fleetwood Oaks Ave Unit 115
- 5234 Fleetwood Oaks Ave Unit 120E
- 5305 Fleetwood Oaks Ave Unit 274
- 5308 Parkland Ave
- 5323 Fleetwood Oaks Ave Unit 256
- 5005 Denton Dr
- 5111 Stoneleigh Ave
- 5106 Stoneleigh Ave
- 2814 Hedgerow Dr
- 5122 Maple Springs Blvd
- 2934 Maple Springs Blvd
- 5049 Cedar Springs Rd Unit 120K
- 5031 Cedar Springs Rd Unit 202
- 2811 Carlson Dr
- 2842 Carlson Dr
- 4804 Bradford Dr
- 3031 Mahanna Springs Dr Unit D Bldg B
- 4711 Sylvester St
- 2602 Kings Rd
- 5212 Fleetwood Oaks Ave Unit 202G
- 5212 Fleetwood Oaks Ave Unit 203
- 5212 Fleetwood Oaks Ave Unit 201G
- 5212 Fleetwood Oaks Ave Unit 103
- 5212 Fleetwood Oaks Ave Unit 102G
- 5212 Fleetwood Oaks Ave Unit 201 Bldg G
- 5212 Fleetwood Oaks Ave Unit 201G
- 5212 Fleetwood Oaks Ave Unit 102
- 5212 Fleetwood Oaks Ave Unit 201 Bldg G
- 5212 Fleetwood Oaks Ave Unit 103
- 5212 Fleetwood Oaks Ave
- 5212 Fleetwood Oaks Ave Unit 101G
- 5212 Fleetwood Oaks Ave Unit 101G
- 5212 Fleetwood Oaks Ave Unit 203
- 5212 Fleetwood Oaks Ave Unit 202G
- 5212 Fleetwood Oaks Ave Unit 103
- 5212 Fleetwood Oaks Ave Unit 202
- 5218 Fleetwood Oaks Ave Unit 207
- 5218 Fleetwood Oaks Ave Unit 108
- 5218 Fleetwood Oaks Ave Unit 207F