Estimated Value: $354,000 - $360,000
--
Bed
3
Baths
2,536
Sq Ft
$140/Sq Ft
Est. Value
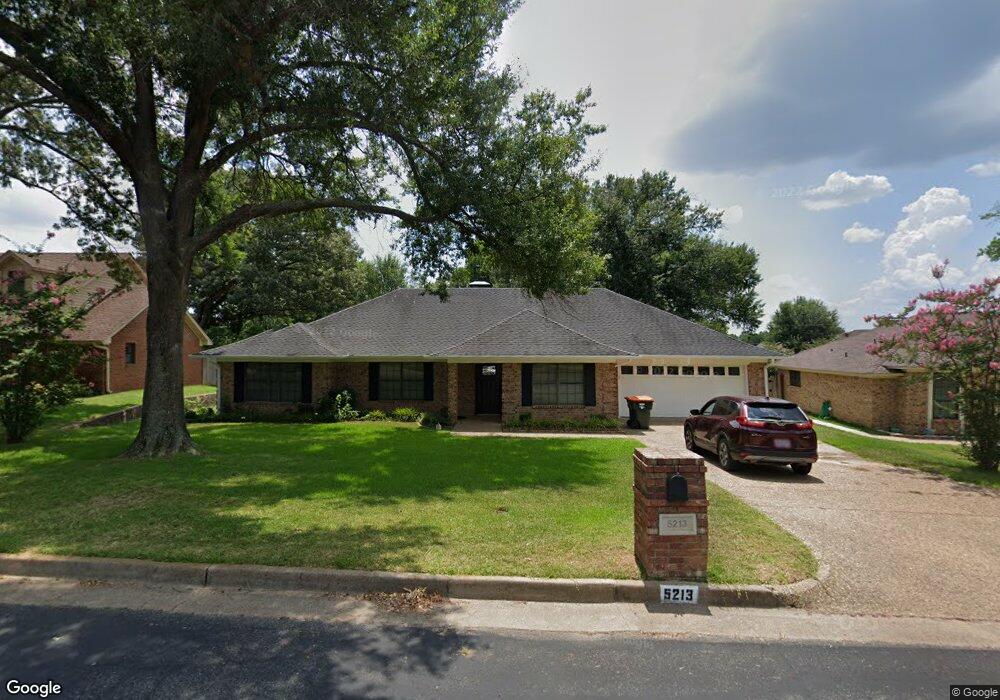
About This Home
This home is located at 5213 5213 Cloverdale, Tyler, TX 75703 and is currently estimated at $356,147, approximately $140 per square foot. 5213 5213 Cloverdale is a home located in Smith County with nearby schools including Rice Elementary School, Hubbard Middle School, and Tyler Legacy High School.
Ownership History
Date
Name
Owned For
Owner Type
Purchase Details
Closed on
Nov 8, 2023
Sold by
Parks Jeffrey and Parks Destiny
Bought by
Montoya Dino and Montoya Christina
Current Estimated Value
Home Financials for this Owner
Home Financials are based on the most recent Mortgage that was taken out on this home.
Original Mortgage
$197,400
Interest Rate
7.57%
Mortgage Type
New Conventional
Purchase Details
Closed on
Jun 4, 2021
Sold by
Gist Brian Shane
Bought by
Gist Misty Leanne
Home Financials for this Owner
Home Financials are based on the most recent Mortgage that was taken out on this home.
Original Mortgage
$182,949
Interest Rate
2.9%
Mortgage Type
Credit Line Revolving
Purchase Details
Closed on
Aug 3, 2007
Sold by
Wizel Benjamin and Maher Maureen T
Bought by
Gist Brian Shane
Home Financials for this Owner
Home Financials are based on the most recent Mortgage that was taken out on this home.
Original Mortgage
$173,850
Interest Rate
7.5%
Mortgage Type
Purchase Money Mortgage
Create a Home Valuation Report for This Property
The Home Valuation Report is an in-depth analysis detailing your home's value as well as a comparison with similar homes in the area
Home Values in the Area
Average Home Value in this Area
Purchase History
| Date | Buyer | Sale Price | Title Company |
|---|---|---|---|
| Montoya Dino | -- | Truly Title | |
| Gist Misty Leanne | -- | None Available | |
| Gist Brian Shane | -- | Smith County Title |
Source: Public Records
Mortgage History
| Date | Status | Borrower | Loan Amount |
|---|---|---|---|
| Previous Owner | Montoya Dino | $197,400 | |
| Previous Owner | Gist Misty Leanne | $182,949 | |
| Previous Owner | Gist Brian Shane | $173,850 |
Source: Public Records
Tax History Compared to Growth
Tax History
| Year | Tax Paid | Tax Assessment Tax Assessment Total Assessment is a certain percentage of the fair market value that is determined by local assessors to be the total taxable value of land and additions on the property. | Land | Improvement |
|---|---|---|---|---|
| 2025 | $4,971 | $339,338 | $55,611 | $283,727 |
| 2024 | $4,971 | $350,640 | $44,000 | $306,640 |
| 2023 | $6,027 | $345,769 | $44,000 | $301,769 |
| 2022 | $5,314 | $281,423 | $43,780 | $237,643 |
| 2021 | $5,173 | $246,583 | $43,780 | $202,803 |
| 2020 | $5,276 | $246,583 | $43,780 | $202,803 |
| 2019 | $5,295 | $250,649 | $43,780 | $206,869 |
| 2018 | $4,788 | $220,125 | $22,000 | $198,125 |
| 2017 | $4,860 | $227,647 | $22,000 | $205,647 |
| 2016 | $4,559 | $213,522 | $22,000 | $191,522 |
| 2015 | $3,765 | $205,357 | $22,000 | $183,357 |
| 2014 | $3,765 | $196,432 | $22,000 | $174,432 |
Source: Public Records
Map
Nearby Homes
- 802 Carriage Dr
- 842 Carriage Dr
- 704 Paloma St
- 5106 Cloverdale Dr
- 709 Top Hill Dr
- 717 Meadow Creek Dr
- 601 Carriage Dr
- 608 Top Hill Dr
- 5401 Hollytree Dr
- 5401 Hollytree Dr Unit 1002
- 1107 Larkspur Ln
- 709 W Rieck Rd
- 1202 Rice Rd
- 5802 Briar Creek Dr
- 1408 Woodbridge Dr
- 1212 Parkview Dr
- 716 Chimney Rock Dr
- 5701 Plantation Dr
- 973 Creekside Dr
- 7434 Waterview Square
- 5213 Cloverdale Dr
- 5211 5211 Cloverdale Dr
- 5215 Cloverdale Dr
- 5211 Cloverdale Dr
- 809 Carriage Dr
- 709 Becky Dr
- 709 709 Becky Dr
- 805 Carriage Dr
- 5209 Cloverdale Dr
- 813 Carriage Dr
- 801 Carriage Dr
- 5206 Cloverdale Dr
- 801 801 Carriage Dr
- 837 Carriage Dr
- 707 Becky Dr
- 841 Carriage Dr
- 706 Becky Dr
- 833 833 Carriage Dr
- 5205 Cloverdale Dr
- 845 Carriage Dr