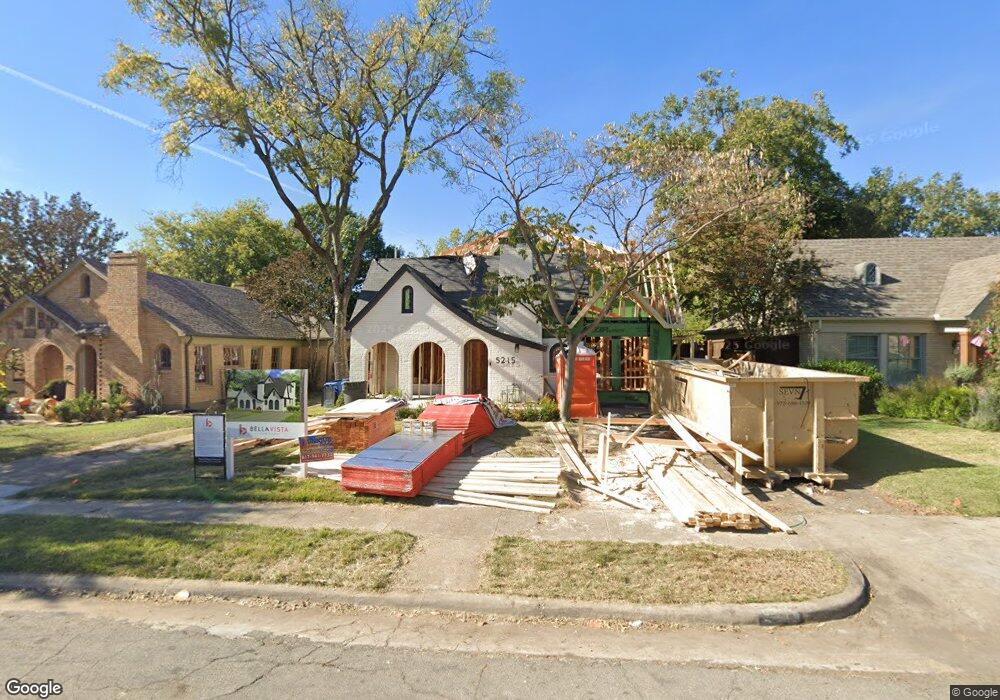
5215 Alcott St Dallas, TX 75206
Old East Dallas NeighborhoodEstimated Value: $580,000 - $673,000
2
Beds
1
Bath
1,172
Sq Ft
$544/Sq Ft
Est. Value
About This Home
This home is located at 5215 Alcott St, Dallas, TX 75206 and is currently estimated at $637,275, approximately $543 per square foot. 5215 Alcott St is a home located in Dallas County with nearby schools including J L Long Middle School, Woodrow Wilson High School, and The Saint Timothy School.
Ownership History
Date
Name
Owned For
Owner Type
Purchase Details
Closed on
Dec 18, 2020
Sold by
Quintanilla Joseph Patrick and Pastor Nicole Renee
Bought by
Quintanilla Joseph Patrick
Current Estimated Value
Purchase Details
Closed on
Sep 4, 2020
Sold by
Chong Cathy F and Estate Of Julian M Chong
Bought by
Quintanilla Joseph Patrick and Pastor Nicole Renee
Home Financials for this Owner
Home Financials are based on the most recent Mortgage that was taken out on this home.
Original Mortgage
$306,800
Interest Rate
3%
Mortgage Type
New Conventional
Purchase Details
Closed on
Jun 28, 2002
Sold by
Belz Jeffrey Dwain
Bought by
Chong Julian M and Chong Cathy F
Home Financials for this Owner
Home Financials are based on the most recent Mortgage that was taken out on this home.
Original Mortgage
$136,800
Interest Rate
6.89%
Create a Home Valuation Report for This Property
The Home Valuation Report is an in-depth analysis detailing your home's value as well as a comparison with similar homes in the area
Home Values in the Area
Average Home Value in this Area
Purchase History
| Date | Buyer | Sale Price | Title Company |
|---|---|---|---|
| Quintanilla Joseph Patrick | -- | None Listed On Document | |
| Quintanilla Joseph Patrick | -- | Itc | |
| Chong Julian M | -- | -- |
Source: Public Records
Mortgage History
| Date | Status | Borrower | Loan Amount |
|---|---|---|---|
| Previous Owner | Quintanilla Joseph Patrick | $306,800 | |
| Previous Owner | Chong Julian M | $136,800 |
Source: Public Records
Tax History Compared to Growth
Tax History
| Year | Tax Paid | Tax Assessment Tax Assessment Total Assessment is a certain percentage of the fair market value that is determined by local assessors to be the total taxable value of land and additions on the property. | Land | Improvement |
|---|---|---|---|---|
| 2025 | $9,169 | $646,800 | $380,000 | $266,800 |
| 2024 | $9,169 | $660,000 | $380,000 | $280,000 |
| 2023 | $9,169 | $577,000 | $380,000 | $197,000 |
| 2022 | $11,295 | $451,720 | $342,000 | $109,720 |
| 2021 | $10,674 | $404,620 | $304,000 | $100,620 |
| 2020 | $11,656 | $429,640 | $304,000 | $125,640 |
| 2019 | $12,224 | $429,640 | $304,000 | $125,640 |
| 2018 | $9,416 | $346,280 | $228,000 | $118,280 |
| 2017 | $8,925 | $328,220 | $228,000 | $100,220 |
| 2016 | $8,925 | $328,220 | $228,000 | $100,220 |
| 2015 | $7,190 | $262,120 | $190,000 | $72,120 |
| 2014 | $7,190 | $262,120 | $190,000 | $72,120 |
Source: Public Records
Map
Nearby Homes
- 5114 Alcott St
- 5020-5022 Pershing St
- 5230 Richard Ave
- 5220 Bonita Ave
- 5020 Pershing St
- 2802 Lee St
- 5029 Pershing St
- 5009 Milam St
- 4931 Homer St
- 4924 Alcott St
- 2626 Madera St
- 5016 Vickery Blvd
- 2623 N Garrett Ave
- 4923 Homer St
- 5231 Manett St
- 4915 Alcott St
- 5000 Mission Ave
- 5135 Vickery Blvd Unit A
- 5230 Vickery Blvd
- 5335 Richard Ave
- 5211 Alcott St
- 5219 Alcott St
- 5207 Alcott St
- 5223 Alcott St
- 5203 Alcott St
- 5227 Alcott St
- 5208 Milam St
- 5210 Milam St
- 5202 Milam St
- 5216 Milam St
- 5216 Milam St
- 5216 Milam St Unit 1
- 5216 Milam St Unit 6
- 5216 Milam St Unit 7
- 5216 Milam St Unit 4
- 5216 Milam St Unit 3
- 5216 Milam St Unit 8
- 5206 Milam St
- 5218 Alcott St
- 5214 Alcott St