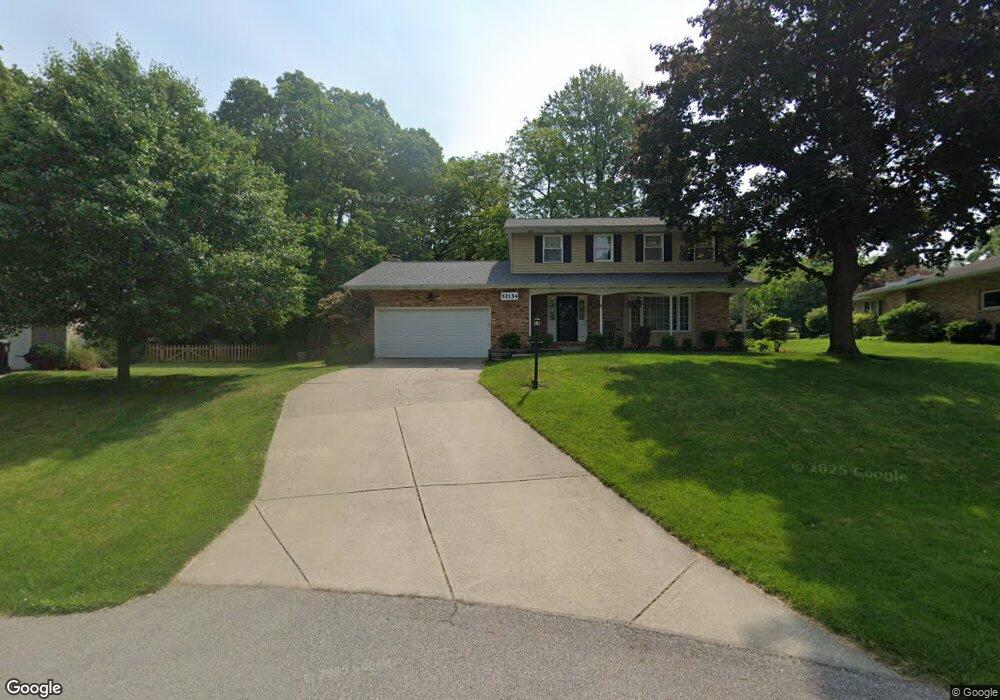
52154 Torch Ct South Bend, IN 46635
Estimated Value: $340,000 - $373,000
4
Beds
3
Baths
2,175
Sq Ft
$162/Sq Ft
Est. Value
About This Home
This home is located at 52154 Torch Ct, South Bend, IN 46635 and is currently estimated at $353,225, approximately $162 per square foot. 52154 Torch Ct is a home located in St. Joseph County with nearby schools including Cora B. Darling Elementary School, Clay Intermediate Center, and Tarkington Traditional School.
Ownership History
Date
Name
Owned For
Owner Type
Purchase Details
Closed on
Nov 15, 2007
Sold by
Lillich Jason R and Lillich Jennifer A
Bought by
Kennedy John M and Kennedy Kathleen S
Current Estimated Value
Home Financials for this Owner
Home Financials are based on the most recent Mortgage that was taken out on this home.
Original Mortgage
$109,950
Outstanding Balance
$69,817
Interest Rate
6.45%
Mortgage Type
New Conventional
Estimated Equity
$283,408
Create a Home Valuation Report for This Property
The Home Valuation Report is an in-depth analysis detailing your home's value as well as a comparison with similar homes in the area
Home Values in the Area
Average Home Value in this Area
Purchase History
| Date | Buyer | Sale Price | Title Company |
|---|---|---|---|
| Kennedy John M | -- | Metropolitan Title Llc |
Source: Public Records
Mortgage History
| Date | Status | Borrower | Loan Amount |
|---|---|---|---|
| Open | Kennedy John M | $109,950 |
Source: Public Records
Tax History Compared to Growth
Tax History
| Year | Tax Paid | Tax Assessment Tax Assessment Total Assessment is a certain percentage of the fair market value that is determined by local assessors to be the total taxable value of land and additions on the property. | Land | Improvement |
|---|---|---|---|---|
| 2024 | $2,603 | $339,700 | $73,700 | $266,000 |
| 2023 | $2,555 | $248,200 | $73,800 | $174,400 |
| 2022 | $2,776 | $245,100 | $73,800 | $171,300 |
| 2021 | $2,662 | $217,700 | $48,000 | $169,700 |
| 2020 | $2,405 | $197,300 | $47,800 | $149,500 |
| 2019 | $1,938 | $189,900 | $46,000 | $143,900 |
| 2018 | $1,743 | $173,300 | $41,700 | $131,600 |
| 2017 | $1,459 | $147,300 | $36,000 | $111,300 |
| 2016 | $1,660 | $159,000 | $36,000 | $123,000 |
| 2014 | $1,654 | $157,500 | $36,000 | $121,500 |
Source: Public Records
Map
Nearby Homes
- 52186 Woodridge Dr
- 17633 Cobblestone Ct
- 18193 Windmill Ct
- 51766 Villager Pkwy
- 17378 Woodhurst Rd
- 18268 Clairmont Dr
- 18268 Burton Dr
- 17328 Deerfield Loop
- 18330 Farm Ln
- 51630 Waterford Ln
- 52284 Farmington Square Rd
- 18391 Crownhill Dr
- 52145 Brookview Ct
- 18225 Amberly Ln
- 51793 Heath Ct
- 51824 Wembley Dr
- 18120 Chipstead Dr
- 51527 Summer Hill Dr
- TBD Emmons Rd
- 52836 Arbor Dr
- 52176 Torch Ct
- 52142 Torch Ct
- 52155 Woodridge Dr
- 52177 Woodridge Dr
- 52193 Woodridge Dr
- 52140 Torch Ct
- 17825 Tallyho Dr E
- 52133 Woodridge Dr
- 17844 Amberwood Ln
- 17803 Tallyho Dr E
- 52155 Torch Ct
- 52177 Torch Ct
- 17803 Tallyho Dr E
- 17803 Tally Ho Dr E
- 52143 Torch Ct
- 17850 Amberwood Ln
- 52199 Torch Ct
- 52105 Woodridge Dr
- 52088 Heather Cove
- 17864 Amberwood Ln