Estimated Value: $276,000 - $288,000
3
Beds
2
Baths
1,989
Sq Ft
$141/Sq Ft
Est. Value
About This Home
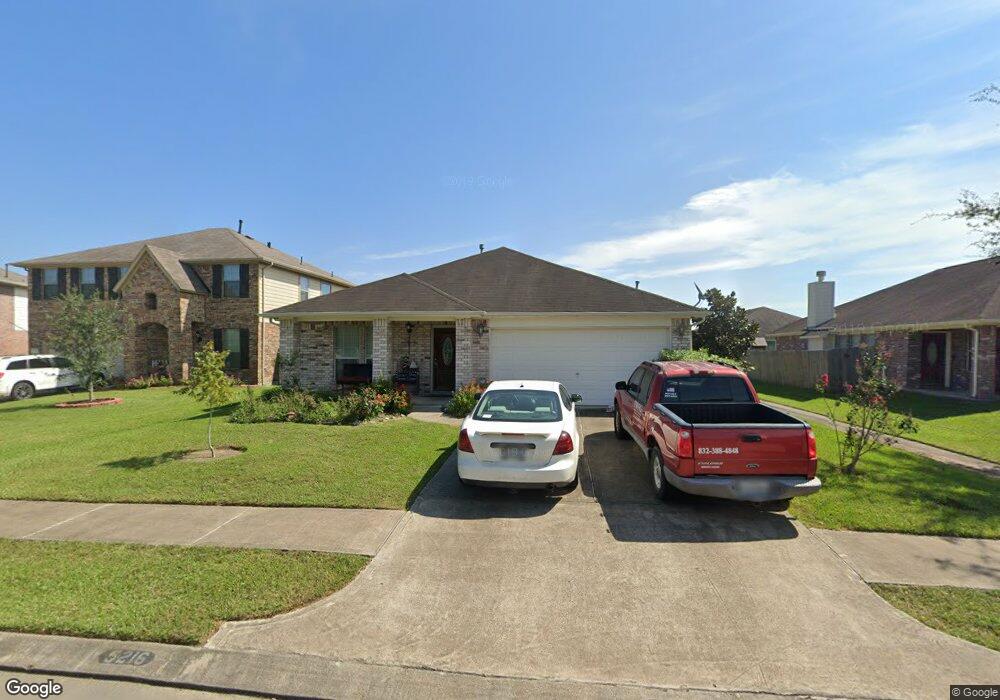
This home is located at 5216 Everts Ave, Alvin, TX 77511 and is currently estimated at $281,375, approximately $141 per square foot. 5216 Everts Ave is a home located in Brazoria County with nearby schools including G.W. Harby Junior High School, Alvin High School, and Living Stones Christian School.
Ownership History
Date
Name
Owned For
Owner Type
Purchase Details
Closed on
Nov 15, 2012
Sold by
Secretary Of Hud
Bought by
Wofford Paul Joseph and Wofford Mary Jo
Current Estimated Value
Purchase Details
Closed on
May 15, 2012
Sold by
Wells Fargo Bank Na
Bought by
The Secretary Of Housing & Urban Develop
Purchase Details
Closed on
May 1, 2012
Sold by
Rollins Cassandra and Rollins Charles F
Bought by
Wells Fargo Bank Na
Purchase Details
Closed on
Feb 28, 2007
Sold by
Choice Homes Inc
Bought by
Rollins Charles F and Rollins Cassandra
Home Financials for this Owner
Home Financials are based on the most recent Mortgage that was taken out on this home.
Original Mortgage
$168,976
Interest Rate
6.21%
Mortgage Type
Purchase Money Mortgage
Create a Home Valuation Report for This Property
The Home Valuation Report is an in-depth analysis detailing your home's value as well as a comparison with similar homes in the area
Home Values in the Area
Average Home Value in this Area
Purchase History
| Date | Buyer | Sale Price | Title Company |
|---|---|---|---|
| Wofford Paul Joseph | -- | None Available | |
| The Secretary Of Housing & Urban Develop | -- | None Available | |
| Wells Fargo Bank Na | $175,371 | None Available | |
| Rollins Charles F | -- | None Available |
Source: Public Records
Mortgage History
| Date | Status | Borrower | Loan Amount |
|---|---|---|---|
| Previous Owner | Rollins Charles F | $168,976 |
Source: Public Records
Tax History Compared to Growth
Tax History
| Year | Tax Paid | Tax Assessment Tax Assessment Total Assessment is a certain percentage of the fair market value that is determined by local assessors to be the total taxable value of land and additions on the property. | Land | Improvement |
|---|---|---|---|---|
| 2025 | $1,951 | $290,060 | $27,300 | $262,760 |
| 2023 | $1,951 | $243,767 | $27,300 | $255,210 |
| 2022 | $6,079 | $221,606 | $26,210 | $215,790 |
| 2021 | $5,816 | $201,460 | $26,210 | $175,250 |
| 2020 | $5,766 | $197,000 | $26,210 | $170,790 |
| 2019 | $5,557 | $185,000 | $21,840 | $163,160 |
| 2018 | $5,476 | $182,000 | $21,840 | $160,160 |
| 2017 | $5,393 | $176,990 | $21,840 | $155,150 |
| 2016 | $5,232 | $183,530 | $21,840 | $161,690 |
| 2015 | $2,198 | $163,470 | $21,840 | $141,630 |
| 2014 | $2,198 | $155,970 | $21,840 | $134,130 |
Source: Public Records
Map
Nearby Homes
- 394 De Coster Blvd
- 417 De Coster Blvd
- 5690 Highway 35 Bypass
- 875 Barrell Rd
- 5323 Latigo Ct
- 5321 Latigo Ct
- 5330 Latigo Ct
- The Princeton II Plan at Kendall Lakes
- The Crawford Plan at Kendall Lakes
- The Davenport II Plan at Kendall Lakes
- The Georgetown II Plan at Kendall Lakes
- The Pearson Plan at Kendall Lakes
- The James Plan at Kendall Lakes
- The McGinnis Plan at Kendall Lakes
- 5318 Latigo Ct
- Madison Plan at Kendall Lakes
- Avery Plan at Kendall Lakes
- Elias Plan at Skyview
- Christina Plan at Kendall Lakes
- Rev Plan at Skyview
- 5218 Everts Ave
- 5214 Everts Ave
- 5219 Mcgrath Dr
- 5221 Mcgrath Dr
- 5217 Mcgrath Dr
- 5220 Everts Ave
- 388 Hannah Ln
- 5212 Everts Ave
- 5223 Mcgrath Dr
- 389 Ward Ln
- 5215 Mcgrath Dr
- 393 Hannah Ln
- 386 Hannah Ln
- 5225 Mcgrath Dr
- 391 Hannah Ln
- 387 Ward Ln
- 5210 Everts Ave
- 389 Hannah Ln
- 5213 Mcgrath Dr
- 5227 Mcgrath Dr