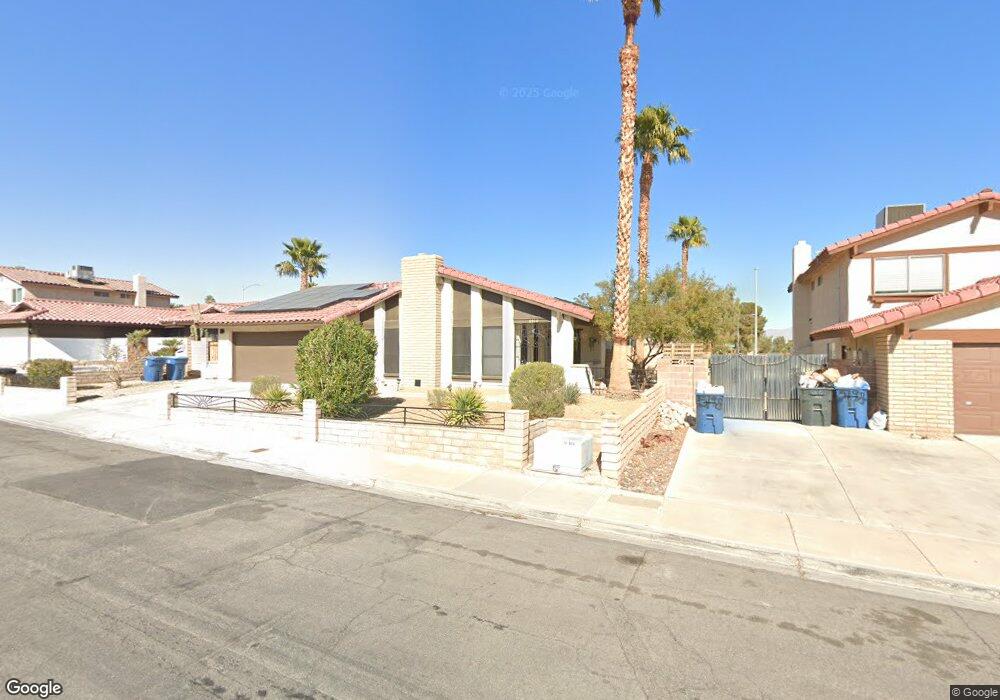
5216 Hibbetts Dr Las Vegas, NV 89103
Estimated Value: $508,194 - $536,000
4
Beds
2
Baths
1,995
Sq Ft
$263/Sq Ft
Est. Value
About This Home
This home is located at 5216 Hibbetts Dr, Las Vegas, NV 89103 and is currently estimated at $525,299, approximately $263 per square foot. 5216 Hibbetts Dr is a home located in Clark County with nearby schools including C H Decker Elementary School, Kenny C Guinn Middle School, and Ed W Clark High School.
Ownership History
Date
Name
Owned For
Owner Type
Purchase Details
Closed on
Aug 9, 2023
Sold by
West Point Investments Llc
Bought by
5216 Hibbetts Llc
Current Estimated Value
Purchase Details
Closed on
Oct 27, 2021
Sold by
Hung Karrie Ying and Karrie Flung Separate Property
Bought by
West Point Investments Llc
Purchase Details
Closed on
Dec 16, 2010
Sold by
Wu Karrie Hung
Bought by
Wu Kevin S and Hung Ying
Purchase Details
Closed on
Jun 23, 2009
Sold by
Andrade Maria A
Bought by
Wu Karrie Hung
Purchase Details
Closed on
Sep 11, 2008
Sold by
Ortiz Maria
Bought by
Andrade Maria A
Purchase Details
Closed on
Feb 1, 2008
Sold by
Chavez Norma
Bought by
Ortiz Maria
Purchase Details
Closed on
Nov 19, 2007
Sold by
Parker John C
Bought by
Chavez Norma
Purchase Details
Closed on
Jan 14, 1994
Sold by
Colombi Frank
Bought by
Parker John Francis
Home Financials for this Owner
Home Financials are based on the most recent Mortgage that was taken out on this home.
Original Mortgage
$138,720
Interest Rate
7.29%
Mortgage Type
VA
Create a Home Valuation Report for This Property
The Home Valuation Report is an in-depth analysis detailing your home's value as well as a comparison with similar homes in the area
Home Values in the Area
Average Home Value in this Area
Purchase History
| Date | Buyer | Sale Price | Title Company |
|---|---|---|---|
| 5216 Hibbetts Llc | -- | None Listed On Document | |
| West Point Investments Llc | -- | None Available | |
| Hung Karrie Ying | -- | None Available | |
| Wu Kevin S | -- | None Available | |
| Wu Karrie Hung | $202,000 | Ticor Title Las Vegas | |
| Andrade Maria A | -- | None Available | |
| Ortiz Maria | -- | None Available | |
| Chavez Norma | $310,000 | Ticor Title Of Nevada Inc | |
| Parker John Francis | $136,000 | Stewart Title |
Source: Public Records
Mortgage History
| Date | Status | Borrower | Loan Amount |
|---|---|---|---|
| Previous Owner | Parker John Francis | $138,720 |
Source: Public Records
Tax History Compared to Growth
Tax History
| Year | Tax Paid | Tax Assessment Tax Assessment Total Assessment is a certain percentage of the fair market value that is determined by local assessors to be the total taxable value of land and additions on the property. | Land | Improvement |
|---|---|---|---|---|
| 2025 | $2,205 | $86,650 | $40,950 | $45,700 |
| 2024 | $2,042 | $86,650 | $40,950 | $45,700 |
| 2023 | $2,042 | $86,223 | $40,950 | $45,273 |
| 2022 | $1,891 | $74,065 | $31,500 | $42,565 |
| 2021 | $2,106 | $71,842 | $30,450 | $41,392 |
| 2020 | $1,623 | $69,803 | $28,000 | $41,803 |
| 2019 | $1,522 | $66,332 | $24,500 | $41,832 |
| 2018 | $1,452 | $64,276 | $23,100 | $41,176 |
| 2017 | $1,894 | $64,576 | $22,050 | $42,526 |
| 2016 | $1,360 | $60,803 | $17,150 | $43,653 |
| 2015 | $1,356 | $53,838 | $10,500 | $43,338 |
| 2014 | $1,314 | $43,474 | $10,500 | $32,974 |
Source: Public Records
Map
Nearby Homes
- 5162 Winston St
- 3826 Edmond St
- 3941 Delos Dr Unit 3
- 3947 Delos Dr
- 0 Spring Mountain Rd Unit 2562224
- 0 Spring Mountain Rd Unit 2562221
- 3972 Tirana Way
- 3641 Ala Dr
- 4000 Camas Ct
- 4015 Delos Dr
- 5191 Pioneer Ave Unit 101
- 4008 Spitze Dr
- 4794 Via Renaldo
- 4795 Via San Andros
- 5480 Cabrito Dr
- 3871 Sauceda Ln
- 4664 W Twain Ave
- 5873 Corazon Dr
- 3346 Tiara Point Cir
- 3372 Westwind Rd
- 5236 Hibbetts Dr
- 5198 Hibbetts Dr
- 5254 Hibbetts Dr
- 5178 Hibbetts Dr
- 5215 Hibbetts Dr
- 5235 Hibbetts Dr
- 5197 Hibbetts Dr
- 5253 Hibbetts Dr
- 3671 Edmond St
- 5274 Hibbetts Dr
- 5160 Hibbetts Dr
- 5177 Hibbetts Dr
- 3676 Hache St
- 5273 Hibbetts Dr
- 5214 Cartaro Dr
- 5234 Cartaro Dr
- 5157 Hibbetts Dr
- 5196 Cartaro Dr
- 5292 Hibbetts Dr
- 5252 Cartaro Dr