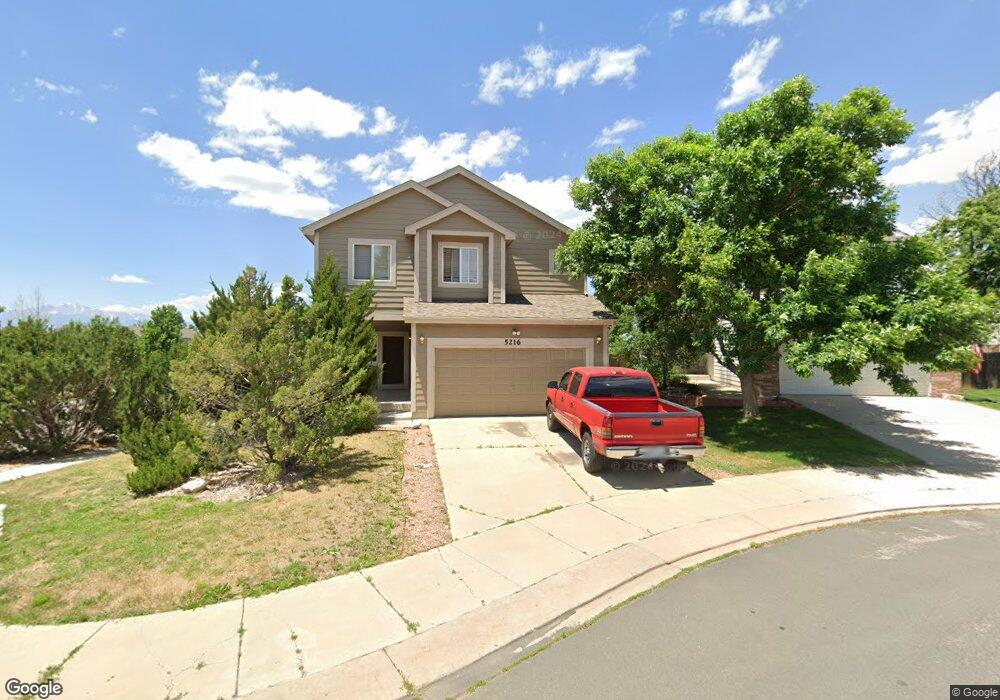
5216 Ladyslipper Ct Colorado Springs, CO 80922
Stetson Hills NeighborhoodEstimated Value: $443,000 - $499,000
4
Beds
3
Baths
2,027
Sq Ft
$233/Sq Ft
Est. Value
About This Home
This home is located at 5216 Ladyslipper Ct, Colorado Springs, CO 80922 and is currently estimated at $471,838, approximately $232 per square foot. 5216 Ladyslipper Ct is a home located in El Paso County with nearby schools including Stetson Elementary School, Skyview Middle School, and Sand Creek High School.
Ownership History
Date
Name
Owned For
Owner Type
Purchase Details
Closed on
Aug 16, 2011
Sold by
Gao Xuejun
Bought by
Zhai
Current Estimated Value
Home Financials for this Owner
Home Financials are based on the most recent Mortgage that was taken out on this home.
Original Mortgage
$123,750
Interest Rate
4.65%
Mortgage Type
New Conventional
Purchase Details
Closed on
Jul 20, 2011
Sold by
Madril Ambrose and Madrin Josefina F
Bought by
Gao Xuejun
Home Financials for this Owner
Home Financials are based on the most recent Mortgage that was taken out on this home.
Original Mortgage
$123,750
Interest Rate
4.65%
Mortgage Type
New Conventional
Purchase Details
Closed on
Aug 17, 2001
Sold by
U S Home Corp
Bought by
Madril Ambrose and Madril Josefina F
Home Financials for this Owner
Home Financials are based on the most recent Mortgage that was taken out on this home.
Original Mortgage
$163,055
Interest Rate
7.16%
Mortgage Type
VA
Create a Home Valuation Report for This Property
The Home Valuation Report is an in-depth analysis detailing your home's value as well as a comparison with similar homes in the area
Home Values in the Area
Average Home Value in this Area
Purchase History
| Date | Buyer | Sale Price | Title Company |
|---|---|---|---|
| Zhai | $165,000 | Unified Title Company | |
| Gao Xuejun | -- | None Available | |
| Madril Ambrose | $185,150 | North American Title |
Source: Public Records
Mortgage History
| Date | Status | Borrower | Loan Amount |
|---|---|---|---|
| Closed | Zhai | $123,750 | |
| Previous Owner | Madril Ambrose | $163,055 |
Source: Public Records
Tax History Compared to Growth
Tax History
| Year | Tax Paid | Tax Assessment Tax Assessment Total Assessment is a certain percentage of the fair market value that is determined by local assessors to be the total taxable value of land and additions on the property. | Land | Improvement |
|---|---|---|---|---|
| 2025 | $1,836 | $32,820 | -- | -- |
| 2024 | $1,737 | $32,840 | $4,620 | $28,220 |
| 2023 | $1,737 | $32,840 | $4,620 | $28,220 |
| 2022 | $1,485 | $23,890 | $4,170 | $19,720 |
| 2021 | $1,547 | $24,580 | $4,290 | $20,290 |
| 2020 | $1,392 | $21,870 | $3,580 | $18,290 |
| 2019 | $1,378 | $21,870 | $3,580 | $18,290 |
| 2018 | $1,145 | $17,840 | $3,020 | $14,820 |
| 2017 | $1,151 | $17,840 | $3,020 | $14,820 |
| 2016 | $1,180 | $18,050 | $2,950 | $15,100 |
| 2015 | $1,181 | $18,050 | $2,950 | $15,100 |
| 2014 | $1,014 | $15,210 | $2,790 | $12,420 |
Source: Public Records
Map
Nearby Homes
- 5175 Stone Fence Dr
- 5225 Stone Fence Dr
- 5041 Weaver Dr
- 5359 Gentle Wind Rd
- 5275 Belle Star Dr
- 5412 Statute Dr
- 5307 Belle Star Dr
- 7668 Amberly Dr
- 7120 Highcroft Dr
- 5315 War Paint Place
- 7010 Highcroft Dr
- 5715 Brennan Ave
- 4831 Desert Varnish Dr
- 7020 Hillbeck Dr
- 7558 Patina Ct
- 5739 Brennan Ave
- 5465 War Paint Place
- 4034 Ryedale Way
- 5002 Sand Ripples Ln
- 5466 Arden Grove
- 5232 Ladyslipper Ct
- 5119 Weaver Dr
- 5248 Ladyslipper Ct
- 5114 Weaver Dr
- 5195 Horse Carriage Rd
- 5125 Weaver Dr
- 5215 Ladyslipper Ct
- 5264 Ladyslipper Ct
- 5108 Weaver Dr
- 5263 Ladyslipper Ct
- 5231 Ladyslipper Ct
- 5247 Ladyslipper Ct
- 5167 Horse Carriage Rd
- 5137 Weaver Dr
- 5096 Weaver Dr
- 5101 Weaver Dr
- 5153 Horse Carriage Rd
- 7137 Arrowroot Ave
- 7141 Arrowroot Ave
- 7133 Arrowroot Ave