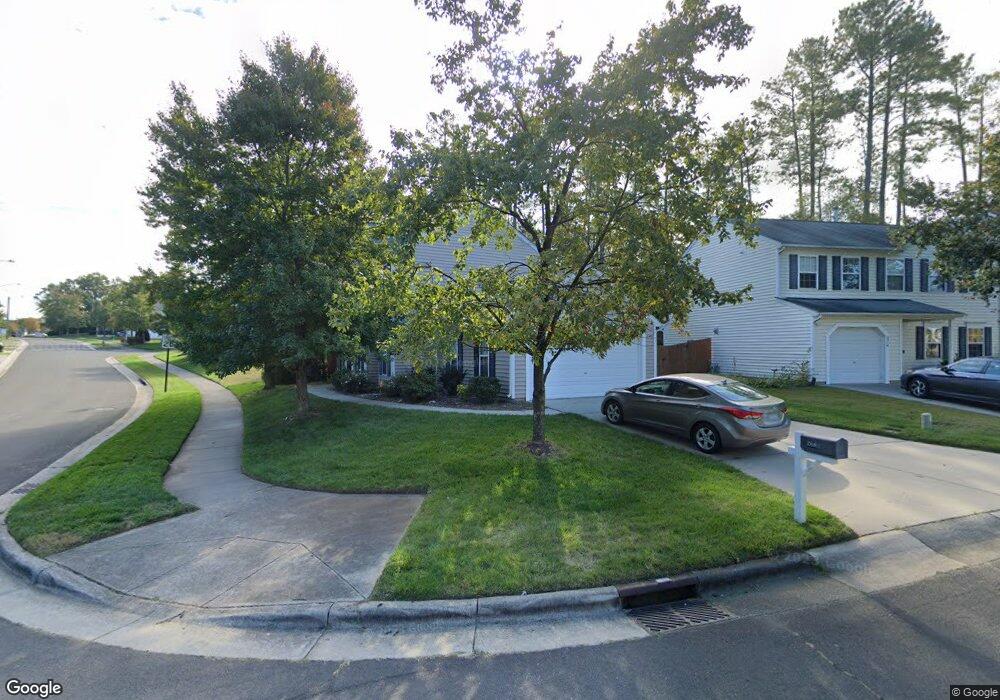
5216 Suda Dr Durham, NC 27703
South Durham NeighborhoodEstimated Value: $360,000 - $376,000
3
Beds
3
Baths
1,672
Sq Ft
$219/Sq Ft
Est. Value
About This Home
This home is located at 5216 Suda Dr, Durham, NC 27703 and is currently estimated at $365,501, approximately $218 per square foot. 5216 Suda Dr is a home located in Durham County with nearby schools including Bethesda Elementary School, John W Neal Middle School, and Southern School of Energy & Sustainability.
Ownership History
Date
Name
Owned For
Owner Type
Purchase Details
Closed on
Mar 29, 2016
Sold by
Poorman Kevin J
Bought by
Merkle Patrick
Current Estimated Value
Home Financials for this Owner
Home Financials are based on the most recent Mortgage that was taken out on this home.
Original Mortgage
$144,800
Outstanding Balance
$115,035
Interest Rate
3.68%
Estimated Equity
$250,466
Purchase Details
Closed on
Jun 18, 2010
Sold by
Watchous Eric D and Watchous Amy D
Bought by
Poorman Kevin J and Poorman Stephanie A
Home Financials for this Owner
Home Financials are based on the most recent Mortgage that was taken out on this home.
Original Mortgage
$176,074
Interest Rate
4.97%
Purchase Details
Closed on
May 7, 2004
Sold by
Anderson Homes Inc
Bought by
Watchous Eric D and Watchous Amy D
Home Financials for this Owner
Home Financials are based on the most recent Mortgage that was taken out on this home.
Original Mortgage
$169,633
Interest Rate
5.88%
Create a Home Valuation Report for This Property
The Home Valuation Report is an in-depth analysis detailing your home's value as well as a comparison with similar homes in the area
Home Values in the Area
Average Home Value in this Area
Purchase History
| Date | Buyer | Sale Price | Title Company |
|---|---|---|---|
| Merkle Patrick | $181,000 | -- | |
| Poorman Kevin J | $178,500 | None Available | |
| Watchous Eric D | $171,000 | -- |
Source: Public Records
Mortgage History
| Date | Status | Borrower | Loan Amount |
|---|---|---|---|
| Open | Merkle Patrick | $144,800 | |
| Previous Owner | Poorman Kevin J | $176,074 | |
| Previous Owner | Watchous Eric D | $169,633 |
Source: Public Records
Tax History
| Year | Tax Paid | Tax Assessment Tax Assessment Total Assessment is a certain percentage of the fair market value that is determined by local assessors to be the total taxable value of land and additions on the property. | Land | Improvement |
|---|---|---|---|---|
| 2025 | $3,500 | $353,022 | $117,600 | $235,422 |
| 2024 | $2,849 | $204,238 | $42,037 | $162,201 |
| 2023 | $2,675 | $204,238 | $42,037 | $162,201 |
| 2022 | $2,614 | $204,238 | $42,037 | $162,201 |
| 2021 | $2,602 | $204,238 | $42,037 | $162,201 |
| 2020 | $2,541 | $204,238 | $42,037 | $162,201 |
| 2019 | $2,541 | $204,238 | $42,037 | $162,201 |
| 2018 | $2,338 | $172,345 | $28,025 | $144,320 |
| 2017 | $2,321 | $172,345 | $28,025 | $144,320 |
| 2016 | $2,242 | $172,345 | $28,025 | $144,320 |
| 2015 | $2,310 | $166,902 | $34,744 | $132,158 |
| 2014 | $2,310 | $166,902 | $34,744 | $132,158 |
Source: Public Records
Map
Nearby Homes
- 19 Gandhi Dr
- 5226 Malik Dr
- 5216 Dilbagh Dr
- 106 Torrey Heights Ln
- 231 Westgrove Ct
- 334 Westgrove Ct
- 136 Torrey Heights Ln
- 107 Vickery Hill Ct
- 117 Torrey Heights Ln
- 12 Sameer Ct
- 1013 Epiphany Rd
- 1005 Epiphany Rd
- 1001 Epiphany Rd
- 3503 Long Ridge Rd
- 464 Brier Summit Place
- 458 Brier Summit Place
- 402 Brier Summit Place
- 1025 Felman Rd
- 9503 Lost Key Ct
- 105 Journey Place
Your Personal Tour Guide
Ask me questions while you tour the home.