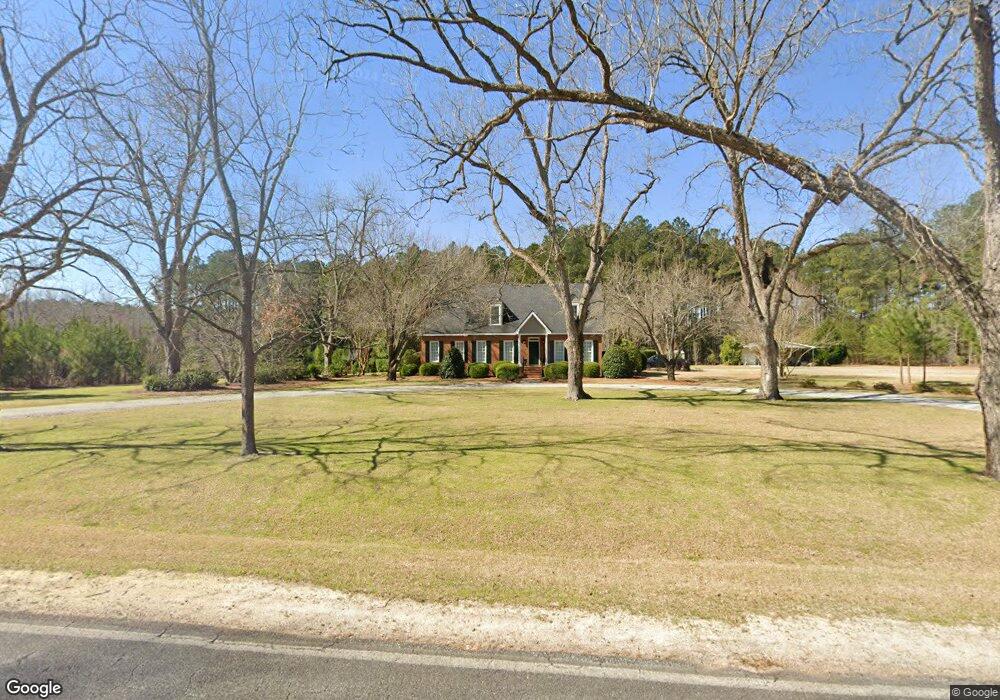
5217 Perry Rd Claxton, GA 30417
Estimated Value: $359,544 - $472,000
3
Beds
4
Baths
2,800
Sq Ft
$153/Sq Ft
Est. Value
About This Home
This home is located at 5217 Perry Rd, Claxton, GA 30417 and is currently estimated at $427,886, approximately $152 per square foot. 5217 Perry Rd is a home located in Evans County with nearby schools including Claxton Elementary School, Claxton Middle School, and Claxton High School.
Ownership History
Date
Name
Owned For
Owner Type
Purchase Details
Closed on
Apr 15, 2011
Sold by
Rose Charles P
Bought by
Kemp Deborah H
Current Estimated Value
Home Financials for this Owner
Home Financials are based on the most recent Mortgage that was taken out on this home.
Original Mortgage
$163,500
Outstanding Balance
$111,256
Interest Rate
4.74%
Estimated Equity
$316,630
Purchase Details
Closed on
Oct 10, 2006
Sold by
Callaway Willim E
Bought by
Rose Lisa M
Purchase Details
Closed on
Jul 12, 2005
Sold by
Hawkins Paul R
Bought by
Rose Charles P and Rose Lisa M
Home Financials for this Owner
Home Financials are based on the most recent Mortgage that was taken out on this home.
Original Mortgage
$170,000
Interest Rate
5.59%
Purchase Details
Closed on
Apr 28, 2004
Sold by
Allen Bruce H and Allen Anne
Bought by
Hawkins Paul R
Purchase Details
Closed on
May 29, 1987
Sold by
Allen Bruce Henry
Bought by
Allen Bruce H and Allen Anne G
Create a Home Valuation Report for This Property
The Home Valuation Report is an in-depth analysis detailing your home's value as well as a comparison with similar homes in the area
Purchase History
| Date | Buyer | Sale Price | Title Company |
|---|---|---|---|
| Kemp Deborah H | $195,500 | -- | |
| Rose Lisa M | $24,000 | -- | |
| Rose Charles P | $206,000 | -- | |
| Hawkins Paul R | $195,000 | -- | |
| Allen Bruce H | -- | -- |
Source: Public Records
Mortgage History
| Date | Status | Borrower | Loan Amount |
|---|---|---|---|
| Open | Kemp Deborah H | $163,500 | |
| Previous Owner | Rose Charles P | $170,000 |
Source: Public Records
Tax History
| Year | Tax Paid | Tax Assessment Tax Assessment Total Assessment is a certain percentage of the fair market value that is determined by local assessors to be the total taxable value of land and additions on the property. | Land | Improvement |
|---|---|---|---|---|
| 2025 | $2,808 | $121,796 | $17,080 | $104,716 |
| 2024 | $2,162 | $113,236 | $17,080 | $96,156 |
| 2023 | $2,162 | $82,348 | $11,040 | $71,308 |
| 2022 | $2,012 | $82,348 | $11,040 | $71,308 |
| 2021 | $2,012 | $78,348 | $11,040 | $67,308 |
| 2020 | $2,020 | $78,668 | $11,040 | $67,628 |
| 2019 | $2,020 | $78,668 | $11,040 | $67,628 |
| 2018 | $1,991 | $77,548 | $11,040 | $66,508 |
| 2017 | $1,993 | $77,628 | $11,040 | $66,588 |
| 2016 | $2,037 | $79,332 | $9,160 | $70,172 |
| 2015 | -- | $81,292 | $9,160 | $72,132 |
| 2014 | -- | $81,292 | $9,160 | $72,132 |
| 2013 | -- | $81,692 | $9,160 | $72,532 |
Source: Public Records
Map
Nearby Homes
- 4909 Perry Rd
- 29 Grove Ln
- 19 Collins St
- 60 Tucker Rd
- 437 Burkhalter Cir
- 0 Turnpike Rd Unit SA339603
- 12 Wisteria Ln
- 12 Wysteria Ln
- 10 Honeysuckle Dr
- 7 Honeysuckle Way
- 3 Wysteria Ln
- 9 Honeysuckle Dr
- 3 Honeysuckle Dr
- 606 Park Ave
- 0 Dublin Rd
- 610 W Liberty St
- 606 W Liberty St
- 307 Mclean St
- 200 Lex Strickland Rd
- 3 S Spring St
- 5099 Perry Rd
- 5072 Perry Rd
- 5375 Tattnall St
- 5019 Perry Rd
- 4966 Perry Rd
- 111 Benjamin Rd
- 17 Benjamin Rd
- 5507 Tattnall St
- 209 Benjamin Rd
- 4857 Perry Rd
- 240 Frances Rd
- 5574 Tattnall St
- 4954 Perry Rd
- 386 Frances Rd
- 311 Benjamin Rd Unit 339
- 6416 Tattnall St
- 4853 Perry Rd
- 5663 Tattnall St
- 5736A Tattnall St
- 5742a Tattnall St
Your Personal Tour Guide
Ask me questions while you tour the home.