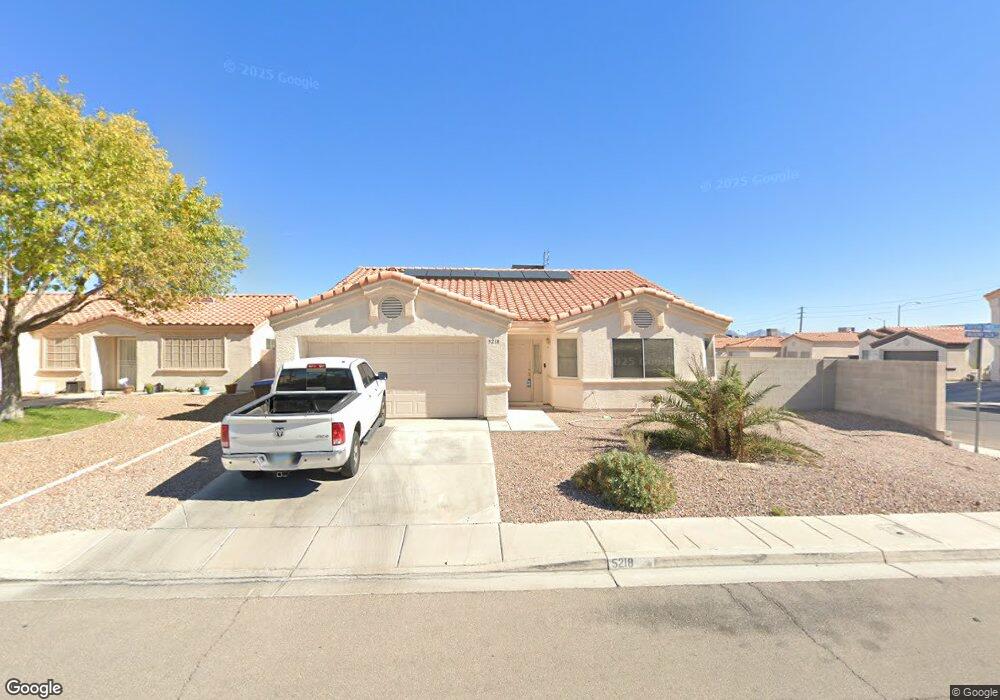
5218 Southern Cypress Ct North Las Vegas, NV 89031
Craig Ranch NeighborhoodEstimated Value: $414,000 - $462,000
4
Beds
2
Baths
1,966
Sq Ft
$218/Sq Ft
Est. Value
About This Home
This home is located at 5218 Southern Cypress Ct, North Las Vegas, NV 89031 and is currently estimated at $428,422, approximately $217 per square foot. 5218 Southern Cypress Ct is a home located in Clark County with nearby schools including Fredric W. Watson Elementary School, Clifford O. Findlay Middle School, and Mojave High School.
Ownership History
Date
Name
Owned For
Owner Type
Purchase Details
Closed on
Jul 12, 2007
Sold by
Las Vegas Solutions Llc
Bought by
Phelps William
Current Estimated Value
Home Financials for this Owner
Home Financials are based on the most recent Mortgage that was taken out on this home.
Original Mortgage
$275,000
Outstanding Balance
$183,776
Interest Rate
7.87%
Mortgage Type
Unknown
Estimated Equity
$244,646
Purchase Details
Closed on
Nov 20, 2006
Sold by
Henderson Percy L and Henderson Nita Y
Bought by
Las Vegas Solutions Llc
Purchase Details
Closed on
Jun 23, 2000
Sold by
Crank Evan and Crank Lisa
Bought by
Henderson Percy L and Henderson Nita Y
Home Financials for this Owner
Home Financials are based on the most recent Mortgage that was taken out on this home.
Original Mortgage
$123,250
Interest Rate
8.63%
Purchase Details
Closed on
Jun 24, 1997
Sold by
Century Homes Ltd
Bought by
Crank Evan and Crank Lisa
Home Financials for this Owner
Home Financials are based on the most recent Mortgage that was taken out on this home.
Original Mortgage
$123,364
Interest Rate
7.23%
Mortgage Type
FHA
Create a Home Valuation Report for This Property
The Home Valuation Report is an in-depth analysis detailing your home's value as well as a comparison with similar homes in the area
Home Values in the Area
Average Home Value in this Area
Purchase History
| Date | Buyer | Sale Price | Title Company |
|---|---|---|---|
| Phelps William | $275,000 | First Amer Title Co Of Nv | |
| Las Vegas Solutions Llc | $235,568 | First Amer Title Co Of Nv | |
| Henderson Percy L | $136,995 | United Title | |
| Crank Evan | $126,500 | Old Republic Title Company |
Source: Public Records
Mortgage History
| Date | Status | Borrower | Loan Amount |
|---|---|---|---|
| Open | Phelps William | $275,000 | |
| Previous Owner | Henderson Percy L | $123,250 | |
| Previous Owner | Crank Evan | $123,364 |
Source: Public Records
Tax History Compared to Growth
Tax History
| Year | Tax Paid | Tax Assessment Tax Assessment Total Assessment is a certain percentage of the fair market value that is determined by local assessors to be the total taxable value of land and additions on the property. | Land | Improvement |
|---|---|---|---|---|
| 2025 | $1,684 | $106,925 | $31,500 | $75,425 |
| 2024 | $1,636 | $106,925 | $31,500 | $75,425 |
| 2023 | $1,197 | $97,492 | $25,900 | $71,592 |
| 2022 | $1,665 | $88,819 | $23,100 | $65,719 |
| 2021 | $1,542 | $83,248 | $20,650 | $62,598 |
| 2020 | $1,429 | $82,168 | $19,950 | $62,218 |
| 2019 | $1,339 | $77,269 | $16,100 | $61,169 |
| 2018 | $1,278 | $71,617 | $12,600 | $59,017 |
| 2017 | $2,307 | $68,782 | $11,900 | $56,882 |
| 2016 | $1,197 | $58,597 | $8,400 | $50,197 |
| 2015 | $1,194 | $43,114 | $5,950 | $37,164 |
| 2014 | $1,157 | $34,663 | $4,900 | $29,763 |
Source: Public Records
Map
Nearby Homes
- 5243 Willowdale Ct
- 524 Rancho Del Sol Way
- 5243 Edna Crane Ave
- 5038 Vista Del Rio Way
- 5313 Jeremy David St
- 5228 Daywood St
- 449 Orchid Oasis Ave
- 429 Orchid Oasis Ave
- 621 Carlos Julio Ave
- 5136 Stonecrop St
- 3601 Allen Creek Ct
- 648 Carlos Julio Ave
- 4915 Via Luis Ct
- 654 Roberta Alecia Ave
- 727 Roberta Alecia Ave
- 229 Stagecoach Flats Ave
- 921 Evening Fawn Dr
- 212 Stagecoach Flats Ave
- 5523 Jose Leon St
- 438 Shimmering Sands Ave
- 5222 Southern Cypress Ct
- 5219 Willowdale Ct
- 5223 Willowdale Ct
- 5226 Southern Cypress Ct
- 433 Mulberry Glen Dr
- 429 Mulberry Glen Dr
- 5227 Willowdale Ct
- 5219 Southern Cypress Ct
- 5215 Southern Cypress Ct
- 425 Mulberry Glen Dr
- 5223 Southern Cypress Ct
- 5230 Southern Cypress Ct
- 5211 Southern Cypress Ct
- 5231 Willowdale Ct
- 5227 Southern Cypress Ct
- 421 Mulberry Glen Dr
- 5207 Southern Cypress Ct
- 5234 Southern Cypress Ct
- 5231 Southern Cypress Ct
- 5218 Willowdale Ct