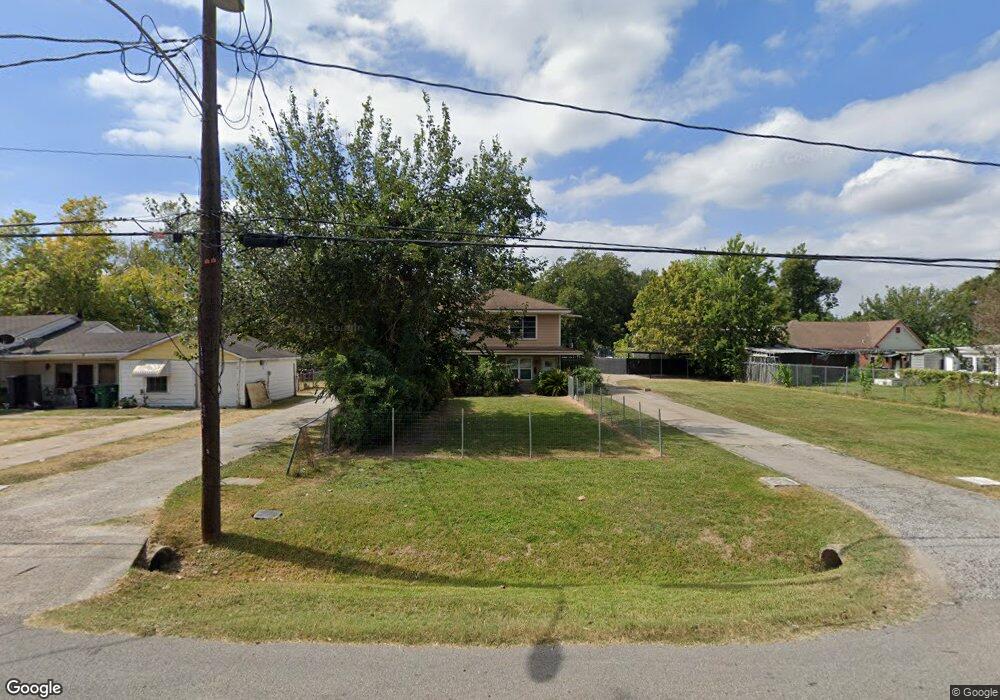
5219 Barrett St Houston, TX 77022
Northside-Northline NeighborhoodEstimated Value: $302,000 - $358,000
2
Beds
2
Baths
1,477
Sq Ft
$227/Sq Ft
Est. Value
About This Home
This home is located at 5219 Barrett St, Houston, TX 77022 and is currently estimated at $335,407, approximately $227 per square foot. 5219 Barrett St is a home located in Harris County with nearby schools including Northline Elementary School, Burbank Middle School, and Sam Houston Math, Science & Technology Center.
Ownership History
Date
Name
Owned For
Owner Type
Purchase Details
Closed on
Nov 30, 2018
Sold by
Mcmillon Real Property Llc
Bought by
Lomac One Investments Llc
Current Estimated Value
Home Financials for this Owner
Home Financials are based on the most recent Mortgage that was taken out on this home.
Original Mortgage
$293,500
Outstanding Balance
$67,875
Interest Rate
4.8%
Mortgage Type
Purchase Money Mortgage
Estimated Equity
$267,532
Create a Home Valuation Report for This Property
The Home Valuation Report is an in-depth analysis detailing your home's value as well as a comparison with similar homes in the area
Home Values in the Area
Average Home Value in this Area
Purchase History
| Date | Buyer | Sale Price | Title Company |
|---|---|---|---|
| Lomac One Investments Llc | -- | None Available |
Source: Public Records
Mortgage History
| Date | Status | Borrower | Loan Amount |
|---|---|---|---|
| Open | Lomac One Investments Llc | $293,500 |
Source: Public Records
Tax History Compared to Growth
Tax History
| Year | Tax Paid | Tax Assessment Tax Assessment Total Assessment is a certain percentage of the fair market value that is determined by local assessors to be the total taxable value of land and additions on the property. | Land | Improvement |
|---|---|---|---|---|
| 2025 | $6,172 | $300,000 | $191,520 | $108,480 |
| 2024 | $6,172 | $295,000 | $191,520 | $103,480 |
| 2023 | $6,172 | $263,840 | $191,520 | $72,320 |
| 2022 | $4,404 | $200,000 | $127,680 | $72,320 |
| 2021 | $4,902 | $210,311 | $127,680 | $82,631 |
| 2020 | $3,875 | $160,000 | $127,680 | $32,320 |
| 2019 | $4,966 | $196,255 | $127,680 | $68,575 |
| 2018 | $2,021 | $80,000 | $79,800 | $200 |
| 2017 | $2,023 | $80,000 | $79,900 | $100 |
| 2016 | $2,344 | $92,690 | $63,840 | $28,850 |
| 2015 | -- | $92,690 | $63,840 | $28,850 |
| 2014 | -- | $92,690 | $63,840 | $28,850 |
Source: Public Records
Map
Nearby Homes
- 5035 North Fwy
- 627 Glenburnie Dr
- 8226 E Tidwell Rd
- Cypress Plan at Wellford Village
- Willow Plan at Wellford Village
- 423 Gammon Dr
- 5701 Luna St
- 0 Burbank St Unit 9886770
- 5203 Burress Springs Ln
- 302 E Rogers St
- 44 Farrell St
- 313 E Tidwell Rd
- 515 Foxglove Ln
- 327 E Delz Dr
- 40 Dipping Ln
- 45 Wellford St
- 319 E Delz Dr
- 70 Burress St
- 9813 Fulton Park Ln
- 9815 Fulton Park Ln
- 5215 Barrett St
- 720 E Rogers St
- 724 E Rogers St
- 5211 Barrett St
- 5207 Barrett St
- 5220 Barrett St
- 710 1/2 E Rogers St
- 810 E Rogers St
- 710 E Rogers St
- 719 E Rogers St
- 5212 Barrett St
- 711 E Burress St
- 5210 Barrett St
- 5302 Barrett St
- 708 E Rogers St
- 719 E Burress St
- 5214 Barrett St
- 5303 Barrett St
- 709 E Burress St
- 706 E Rogers St