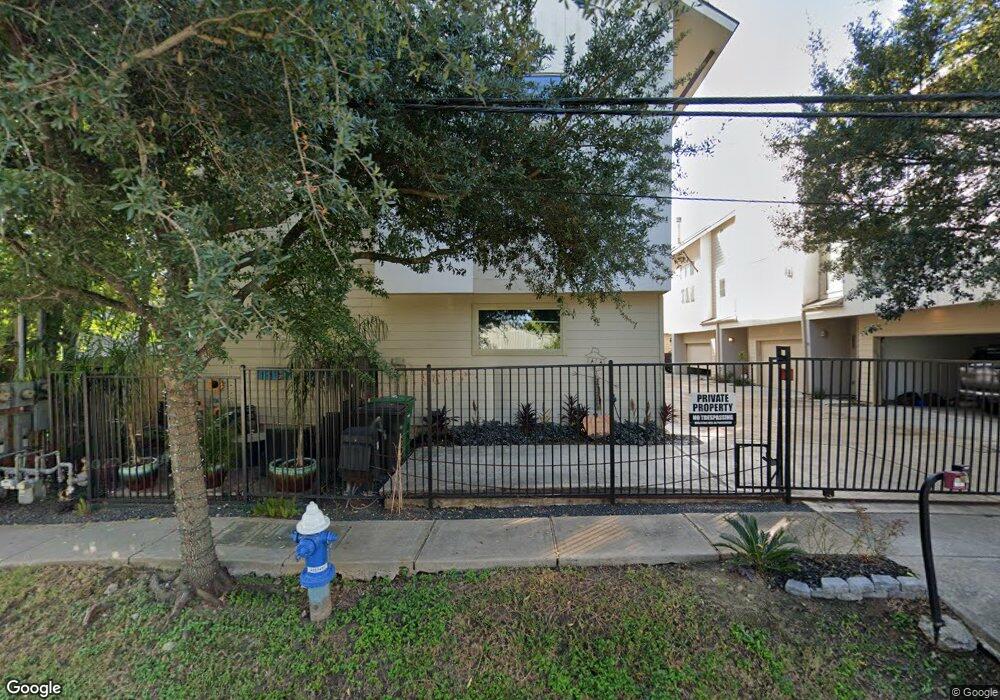
5219 Kiam St Unit F Houston, TX 77007
Cottage Grove NeighborhoodEstimated Value: $344,588 - $369,000
2
Beds
2
Baths
1,816
Sq Ft
$198/Sq Ft
Est. Value
About This Home
This home is located at 5219 Kiam St Unit F, Houston, TX 77007 and is currently estimated at $358,897, approximately $197 per square foot. 5219 Kiam St Unit F is a home located in Harris County with nearby schools including Love Elementary School, Hogg Middle, and Waltrip High School.
Ownership History
Date
Name
Owned For
Owner Type
Purchase Details
Closed on
Nov 7, 2016
Sold by
Anthony D Ritacco
Bought by
Stephens Danielle
Current Estimated Value
Home Financials for this Owner
Home Financials are based on the most recent Mortgage that was taken out on this home.
Original Mortgage
$313,222
Outstanding Balance
$252,410
Interest Rate
3.54%
Estimated Equity
$106,487
Purchase Details
Closed on
Oct 31, 2016
Sold by
Bertram Matt
Bought by
Papp Debbie Lynn Schindler
Home Financials for this Owner
Home Financials are based on the most recent Mortgage that was taken out on this home.
Original Mortgage
$313,222
Outstanding Balance
$252,410
Interest Rate
3.54%
Estimated Equity
$106,487
Purchase Details
Closed on
Sep 20, 2012
Sold by
Depko Erik M
Bought by
Bertram Matt
Purchase Details
Closed on
May 21, 2009
Sold by
Atriham Adan and Chan Michelle Wei Cheng
Bought by
Depko Erik M
Home Financials for this Owner
Home Financials are based on the most recent Mortgage that was taken out on this home.
Original Mortgage
$211,105
Interest Rate
4.84%
Mortgage Type
FHA
Create a Home Valuation Report for This Property
The Home Valuation Report is an in-depth analysis detailing your home's value as well as a comparison with similar homes in the area
Home Values in the Area
Average Home Value in this Area
Purchase History
| Date | Buyer | Sale Price | Title Company |
|---|---|---|---|
| Stephens Danielle | -- | -- | |
| Papp Debbie Lynn Schindler | -- | Title Co Llc | |
| Bertram Matt | -- | None Available | |
| Depko Erik M | -- | American Title Company |
Source: Public Records
Mortgage History
| Date | Status | Borrower | Loan Amount |
|---|---|---|---|
| Open | Stephens Danielle | $313,222 | |
| Closed | Stephens Danielle | -- | |
| Previous Owner | Depko Erik M | $211,105 |
Source: Public Records
Tax History Compared to Growth
Tax History
| Year | Tax Paid | Tax Assessment Tax Assessment Total Assessment is a certain percentage of the fair market value that is determined by local assessors to be the total taxable value of land and additions on the property. | Land | Improvement |
|---|---|---|---|---|
| 2025 | $7,467 | $359,000 | $140,560 | $218,440 |
| 2024 | $7,467 | $356,867 | $140,560 | $216,307 |
| 2023 | $7,467 | $348,900 | $120,480 | $228,420 |
| 2022 | $6,946 | $315,449 | $110,440 | $205,009 |
| 2021 | $6,409 | $275,000 | $106,424 | $168,576 |
| 2020 | $6,797 | $280,700 | $100,400 | $180,300 |
| 2019 | $7,113 | $281,094 | $120,480 | $160,614 |
| 2018 | $7,338 | $290,000 | $96,384 | $193,616 |
| 2017 | $7,333 | $290,000 | $96,384 | $193,616 |
| 2016 | $7,080 | $290,021 | $96,384 | $193,637 |
| 2015 | $4,604 | $290,021 | $96,384 | $193,637 |
| 2014 | $4,604 | $258,547 | $84,336 | $174,211 |
Source: Public Records
Map
Nearby Homes
- 5219 Kiam St Unit F
- 5219 Kiam St Unit E
- 5210 Petty St Unit C
- 5226 Kiam St Unit 1002
- 5229 Petty St Unit E
- 5206 Petty St
- 5217 Kansas St
- 5224 Darling St Unit B
- 5228 Darling St Unit B
- 2402 Reinerman St
- 5241 Darling St
- 2303 Roy Cir
- 5112 Larkin St
- 5308 Larkin St Unit B
- 2115 Detering St
- 5240 Cornish St Unit B
- 5342 Petty St
- 5233 Cornish St Unit C
- 2550 Roy Cir
- 5335 Larkin St
- 5219 Kiam St
- 5219 Kiam St Unit C
- 5219 Kiam St Unit A
- 5219 Kiam St Unit B
- 5219 Kiam St Unit D
- 5227 Kiam St
- 5213 Kiam St
- 5224 Petty St
- 5220 Petty St
- 5207 Kiam St
- 5222 Petty St
- 5218 Petty St Unit B
- 5218 Petty St Unit F
- 5218 Petty St Unit E
- 5218 Petty St Unit C
- 5218 Petty St Unit A
- 5231 Kiam St Unit C
- 5231 Kiam St Unit A
- 5231 Kiam St
- 5231 Kiam St Unit B