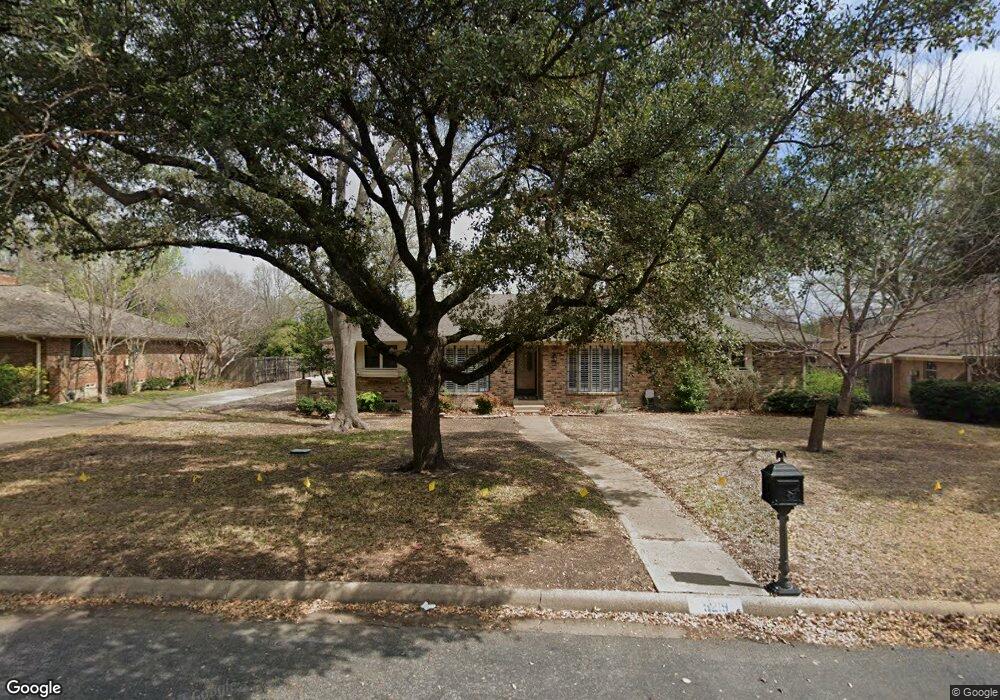
5219 Natchez Dr Sachse, TX 75048
Estimated Value: $381,000 - $509,000
3
Beds
3
Baths
2,118
Sq Ft
$202/Sq Ft
Est. Value
About This Home
This home is located at 5219 Natchez Dr, Sachse, TX 75048 and is currently estimated at $428,407, approximately $202 per square foot. 5219 Natchez Dr is a home located in Dallas County with nearby schools including Firewheel Christian Academy, Oakhill Day School, and Pinnacle Montessori of Sachse.
Ownership History
Date
Name
Owned For
Owner Type
Purchase Details
Closed on
Jun 10, 2010
Sold by
Sandel Mark Hayden and Sandel Michael Nathan
Bought by
Nash Dorothy J and Smith Sara Nash
Current Estimated Value
Purchase Details
Closed on
Apr 26, 2010
Sold by
Fannie Mae
Bought by
Martinez Jose Luis and Martinez Ebelia R
Purchase Details
Closed on
Mar 10, 2010
Sold by
Vintage Contemporaries I Ltd
Bought by
Vintage Contemporaries Inc
Purchase Details
Closed on
Sep 26, 2006
Sold by
Tuttle Carrie Ann
Bought by
Tuttle James Kevin
Purchase Details
Closed on
Jun 18, 1999
Sold by
Stevenson Perry L and Stevenson Cathy L
Bought by
Tuttle James and Tuttle Carrie A
Home Financials for this Owner
Home Financials are based on the most recent Mortgage that was taken out on this home.
Original Mortgage
$128,250
Interest Rate
7.11%
Create a Home Valuation Report for This Property
The Home Valuation Report is an in-depth analysis detailing your home's value as well as a comparison with similar homes in the area
Home Values in the Area
Average Home Value in this Area
Purchase History
| Date | Buyer | Sale Price | Title Company |
|---|---|---|---|
| Nash Dorothy J | -- | Rtt | |
| Martinez Jose Luis | -- | Rtt | |
| Vintage Contemporaries Inc | -- | None Available | |
| Tuttle James Kevin | -- | Atc | |
| Tuttle James | -- | -- |
Source: Public Records
Mortgage History
| Date | Status | Borrower | Loan Amount |
|---|---|---|---|
| Previous Owner | Tuttle James | $128,250 | |
| Closed | Tuttle James Kevin | $0 |
Source: Public Records
Tax History Compared to Growth
Tax History
| Year | Tax Paid | Tax Assessment Tax Assessment Total Assessment is a certain percentage of the fair market value that is determined by local assessors to be the total taxable value of land and additions on the property. | Land | Improvement |
|---|---|---|---|---|
| 2025 | $5,334 | $326,350 | $95,000 | $231,350 |
| 2024 | $5,334 | $326,350 | $95,000 | $231,350 |
| 2023 | $5,334 | $321,640 | $95,000 | $226,640 |
| 2022 | $5,201 | $308,160 | $0 | $0 |
| 2021 | $5,868 | $228,000 | $60,000 | $168,000 |
| 2020 | $5,965 | $255,000 | $0 | $0 |
| 2019 | $5,285 | $186,310 | $55,000 | $131,310 |
| 2018 | $2,320 | $186,310 | $55,000 | $131,310 |
| 2017 | $2,354 | $213,030 | $55,000 | $158,030 |
| 2016 | $5,084 | $177,030 | $40,000 | $137,030 |
| 2015 | $4,021 | $164,730 | $28,300 | $136,430 |
| 2014 | $4,021 | $164,730 | $28,300 | $136,430 |
Source: Public Records
Map
Nearby Homes
- 5205 Jefferson Dr
- 5007 Jefferson Dr
- 5100 Murphy Rd
- 5117 Greensboro Dr
- 5302 Murphy Rd
- TBS Hwy78
- 2006 Cornwall Ln
- 2209 Vicksburg Dr
- 2402 Ash Ln
- 1526 Bonanza Ct
- 1214 Luna Ln
- 2414 Ash Ln
- 2418 Ash Ln
- 2422 Ash Ln
- 1205 Luna Ln
- 2004 Bonanza Dr
- 2406 Bent Oak Trail
- 2402 Bent Oak Trail
- 1313 Bobby Boyd Ln
- 1230 Donegal Ln
- 5223 Natchez Dr
- 5215 Natchez Dr
- 5107 Natchez Dr
- 5103 Natchez Dr
- 5227 Natchez Dr
- 5211 Natchez Dr
- 5218 Natchez Dr
- 5222 Natchez Dr
- 5007 Natchez Dr
- 5214 Natchez Dr
- 5224 Natchez Dr
- 5229 Natchez Dr
- 5104 Jefferson Dr
- 5005 Natchez Dr
- 5104 Natchez Dr
- 5102 Natchez Dr
- 5210 Natchez Dr
- 5206 Jefferson Dr
- 5008 Natchez Dr
- 5202 Natchez Dr