NOT LISTED FOR SALE

5219 Parkside Dr SE Conyers, GA 30094

Estimated Value: $308,000 - $346,000

4 Beds
3 Baths
2,112 Sq Ft
$153/Sq Ft Est. Value

Last Sold September 12, 2014

Last sale price $117,000 $55 Per Sq Ft

Est. 176% increase in value since last sale

Current estimated payment $1,968/month

About This Home

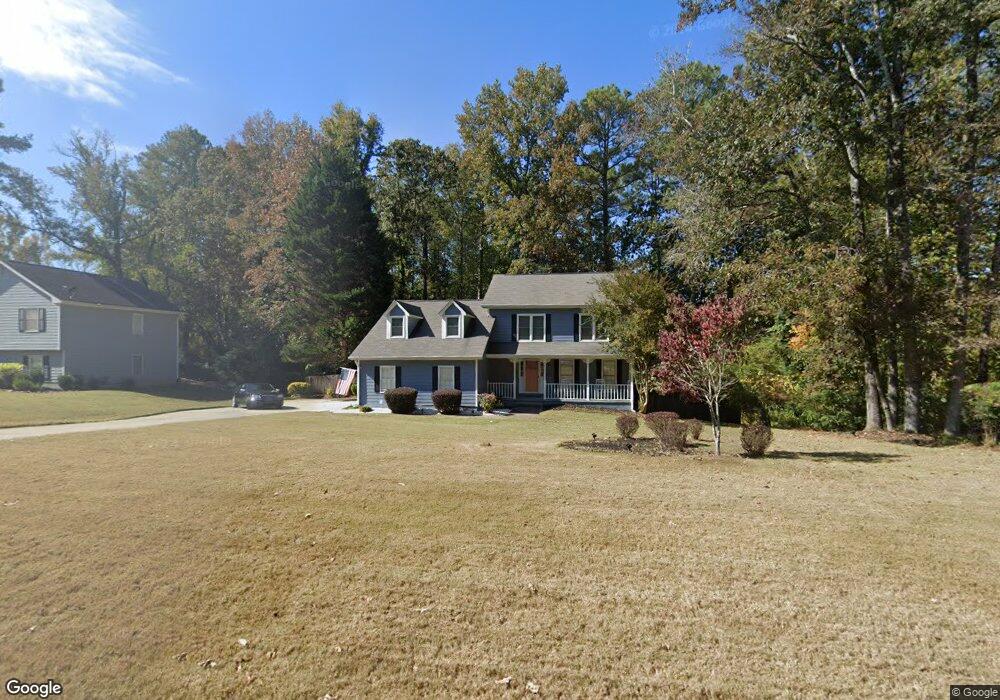
HUGE FAMILY HOME IN SWIM/TENNIS/LAKE COMMUNITY PERFECT FOR GROWING FAMILY. LARGE CORNER LOT WITH WOOD PRIVACY FENCE. IDEAL FOR CHILDREN AND PETS. SEP FAMILY, LIVING & DINING ROOMS. EASY SHOW. Please make appointment

Ownership History

Date Name Owned For Owner Type

Purchase Details

Listed on
Apr 15, 2014
Closed on
Sep 12, 2014
Sold by
Taylor Mary Jan
Bought by
Bright Celeste
Seller's Agent
Carol Moore
BHGRE Metro Brokers
Buyer's Agent
Mary Rodgers
Atlanta Communities
List Price
$144,900
Sold Price
$117,000
Premium/Discount to List
-$27,900
-19.25%
Current Estimated Value
$322,624

Home Financials for this Owner

Home Financials are based on the most recent Mortgage that was taken out on this home.
Estimated Appreciation
$205,624
Avg. Annual Appreciation
9.48%
Original Mortgage
$114,880
Outstanding Balance
$87,062
Interest Rate
3.87%
Mortgage Type
FHA
Estimated Equity
$235,562
Source: Public Records

Range of Values:

--
Value Increase
--
Percent Increase
--
Adjusted for Inflation
Collateral Analytics

Collateral Analytics Collateral Analytics AVMs (Automated Valuation Model) employ a number of statistical approaches combined with neighborhood-specific comparable selection guarantees the most up-to-date and precise valuations.

Not Available

Collateral Analytics does not have data for the current month. Please view the chart for historical values.

ICE

ICE Mortgage Technology ICE Mortgage Technology’s AVM (Automated Valuation Model) is a state-of-the-art online residential property valuation tool that provides a quick and accurate estimate of the value of almost any home in the U.S.

Not Available

ICE Mortgage Technology does not have data for the current month. Please view the chart for historical values.

First American

First American First American Data & Analytics’ next-generation AVM combines unrivaled data assets with a blended ensemble of valuation models to produce highly accurate, reliable valuations you can trust.

Not Available

First American does not have data for the current month. Please view the chart for historical values.

Quantarium

Quantarium Quantarium’s valuation service, repeatedly proven the industry’s most accurate and comprehensive, is supercharged with a self-learning and auto-tuning AI engine that continually becomes smarter and more accurate as it processes daily inputs from the industry’s leading RE data lake.

Not Available

Quantarium does not have data for the current month. Please view the chart for historical values.

Average Value
Not Available
List Price
Sold Price
Create a Home Valuation Report for This Property
The Home Valuation Report is an in-depth analysis detailing your home's value as well as a comparison with similar homes in the area

Home Values in the Area

Source: Public Records

Average Home Value in this Area


Source: Public Records

Purchase History

Date Buyer Sale Price Title Company
Bright Celeste $117,000 --
Source: Public Records

Mortgage History

Date Status Borrower Loan Amount
Open Bright Celeste $114,880
Source: Public Records

Property History

Date Event Price List to Sale Price per Sq Ft Prior Sale
09/12/2014 09/12/14 Sold $117,000 -19.3% $55 / Sq Ft View Prior Sale
08/13/2014 08/13/14 Pending -- -- --
04/15/2014 04/15/14 For Sale $144,900 -- $69 / Sq Ft

Tax History Compared to Growth

Source: Public Records

Tax History

Year Tax Paid Tax Assessment Tax Assessment Total Assessment is a certain percentage of the fair market value that is determined by local assessors to be the total taxable value of land and additions on the property. Land Improvement
2024 $3,164 $129,120 $25,360 $103,760
2023 $2,671 $113,920 $26,400 $87,520
2022 $2,224 $96,520 $22,640 $73,880
2021 $1,998 $83,720 $17,040 $66,680
2020 $1,809 $74,720 $13,560 $61,160
2019 $1,457 $61,800 $10,840 $50,960
2018 $1,309 $56,720 $9,680 $47,040
2017 $949 $44,680 $8,680 $36,000
2016 $877 $44,680 $8,680 $36,000
2015 $2,053 $44,680 $8,680 $36,000
2014 $749 $43,120 $8,000 $35,120
2013 -- $50,040 $12,000 $38,040
Source: Public Records

Agents Affiliated with this Home

  • Section Image
  • Section Image
See All Agents

Map