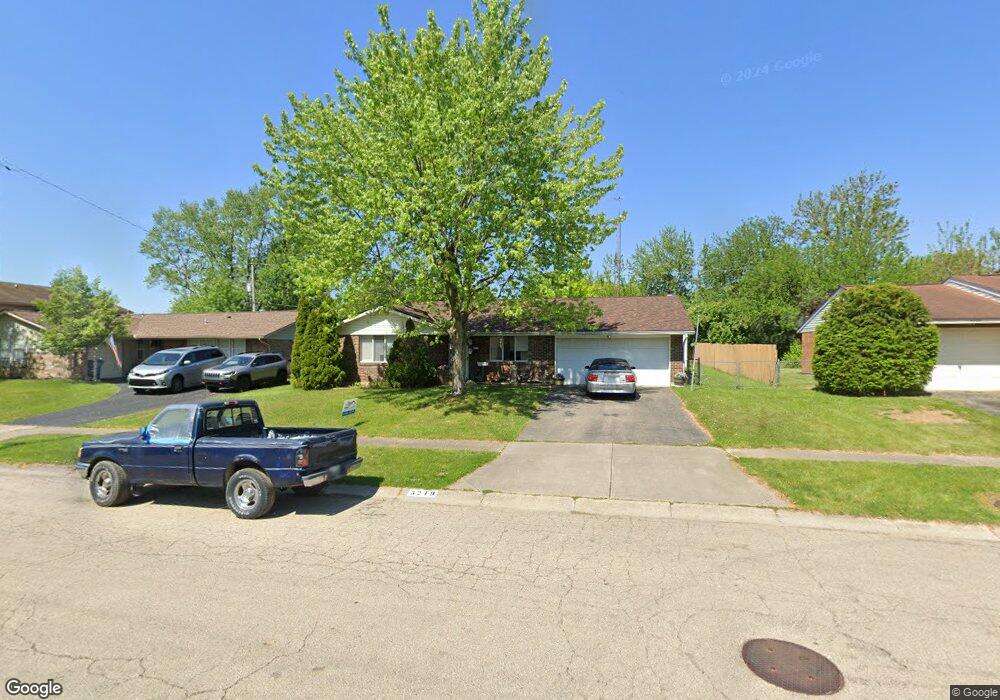
5219 Pollard Way Dayton, OH 45424
Estimated Value: $198,000 - $207,004
3
Beds
2
Baths
1,462
Sq Ft
$139/Sq Ft
Est. Value
About This Home
This home is located at 5219 Pollard Way, Dayton, OH 45424 and is currently estimated at $203,501, approximately $139 per square foot. 5219 Pollard Way is a home located in Montgomery County with nearby schools including Wayne High School and Pathway School of Discovery.
Ownership History
Date
Name
Owned For
Owner Type
Purchase Details
Closed on
May 21, 2025
Sold by
Sheriff Of Montgomery County
Bought by
Pheonix Ii Llc
Current Estimated Value
Purchase Details
Closed on
Jan 24, 2020
Sold by
Miller Alice
Bought by
Miller Alice
Home Financials for this Owner
Home Financials are based on the most recent Mortgage that was taken out on this home.
Original Mortgage
$183,000
Interest Rate
5.41%
Mortgage Type
FHA
Purchase Details
Closed on
Jul 26, 2019
Sold by
Estate Of Dorothy F Peskin
Bought by
Miller Alice
Purchase Details
Closed on
Apr 14, 1998
Sold by
Alimonos Vasso Trustee
Bought by
Peskin Dorothy F
Home Financials for this Owner
Home Financials are based on the most recent Mortgage that was taken out on this home.
Original Mortgage
$72,800
Interest Rate
7.27%
Create a Home Valuation Report for This Property
The Home Valuation Report is an in-depth analysis detailing your home's value as well as a comparison with similar homes in the area
Home Values in the Area
Average Home Value in this Area
Purchase History
| Date | Buyer | Sale Price | Title Company |
|---|---|---|---|
| Pheonix Ii Llc | $198,800 | None Listed On Document | |
| Miller Alice | -- | Fnc Title Services Llc | |
| Miller Alice | -- | None Available | |
| Peskin Dorothy F | $91,000 | -- | |
| Peskin Dorothy F | $91,000 | -- |
Source: Public Records
Mortgage History
| Date | Status | Borrower | Loan Amount |
|---|---|---|---|
| Previous Owner | Miller Alice | $183,000 | |
| Previous Owner | Peskin Dorothy F | $72,800 |
Source: Public Records
Tax History Compared to Growth
Tax History
| Year | Tax Paid | Tax Assessment Tax Assessment Total Assessment is a certain percentage of the fair market value that is determined by local assessors to be the total taxable value of land and additions on the property. | Land | Improvement |
|---|---|---|---|---|
| 2024 | $2,313 | $53,950 | $10,010 | $43,940 |
| 2023 | $2,313 | $53,950 | $10,010 | $43,940 |
| 2022 | $1,897 | $37,690 | $7,000 | $30,690 |
| 2021 | $1,927 | $37,690 | $7,000 | $30,690 |
| 2020 | $1,929 | $37,690 | $7,000 | $30,690 |
| 2019 | $2,637 | $35,230 | $7,000 | $28,230 |
| 2018 | $2,646 | $35,230 | $7,000 | $28,230 |
| 2017 | $2,628 | $35,230 | $7,000 | $28,230 |
| 2016 | $1,842 | $32,650 | $7,000 | $25,650 |
| 2015 | $1,819 | $32,650 | $7,000 | $25,650 |
| 2014 | $1,819 | $32,650 | $7,000 | $25,650 |
| 2012 | -- | $33,210 | $8,750 | $24,460 |
Source: Public Records
Map
Nearby Homes
- 4364 Leston Ave
- 4093 Vitek Dr Unit 4093
- 4470 Mahler Dr
- 4407 Nowak Ave
- 4440 Longfellow Ave
- 4608 Nowak Ave
- 4646 Wayne Meadows Cir Unit 4640
- 4640 Wayne Meadows Cir
- 5720 Old Troy Pike
- 5433 Pentland Cir
- 5365 Mariner Dr
- 4488 Northern Cir
- 5660 Tomberg St
- 5059 Key West Dr
- 5784 Pennywell Dr
- 4309 Kitridge Rd
- 5669 Traymore Dr
- 5560 Harshmanville Rd
- 4633 Elysian Way
- 5431 Naughton Dr
- 5225 Pollard Way
- 5213 Pollard Way
- 5225 Troy Pike
- 5225 Old Troy Pike
- 5210 Troy Pike
- 5220 Troy Pike
- 5202 Troy Pike
- 5231 Pollard Way
- 5207 Pollard Way
- 5214 Pollard Way
- 5228 Troy Pike
- 5180 Troy Pike
- 5226 Pollard Way
- 5237 Pollard Way
- 5208 Pollard Way
- 5176 Troy Pike
- 5201 Pollard Way
- 5236 Troy Pike
- 5236 Pollard Way
- 5200 Pollard Way