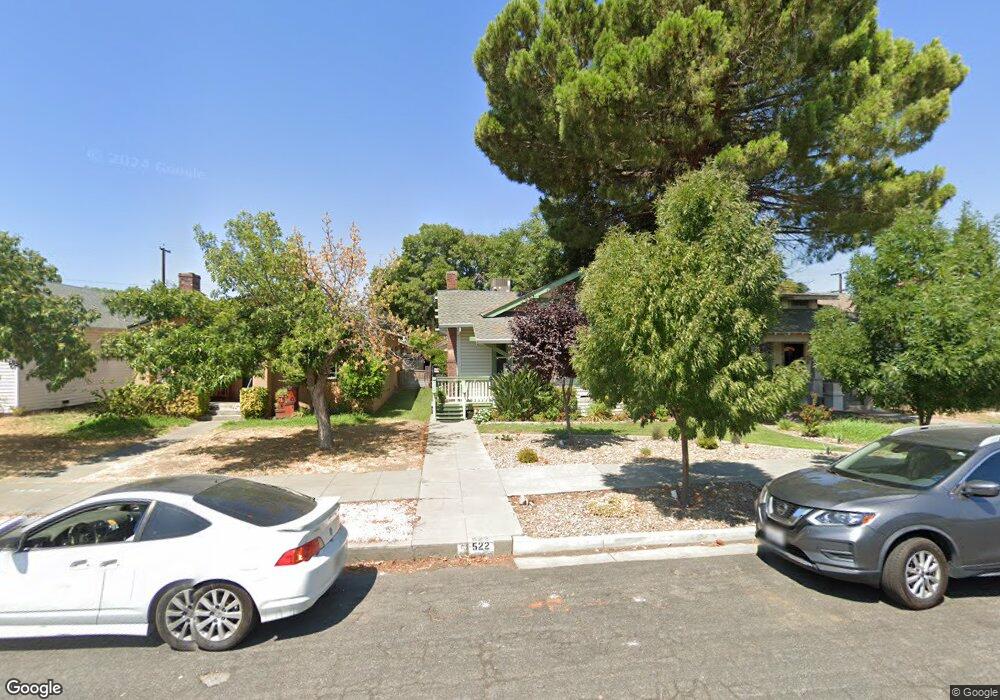
522 1st St Orland, CA 95963
Estimated Value: $241,704 - $307,000
2
Beds
1
Bath
1,138
Sq Ft
$241/Sq Ft
Est. Value
About This Home
This home is located at 522 1st St, Orland, CA 95963 and is currently estimated at $274,176, approximately $240 per square foot. 522 1st St is a home located in Glenn County with nearby schools including Mill Street Elementary School, Fairview Elementary School, and Price Intermediate School.
Ownership History
Date
Name
Owned For
Owner Type
Purchase Details
Closed on
Feb 22, 2022
Sold by
Robert L Calkins Separate Property Trust
Bought by
Sandra S Calkins Revocable Inter Vivos Trust
Current Estimated Value
Purchase Details
Closed on
Jul 15, 2021
Sold by
Leonard Calkins Robert
Bought by
Robert L Calkins Separate Property Trust
Purchase Details
Closed on
Oct 13, 2015
Sold by
Calkins Robert L
Bought by
Calkins Robert L
Purchase Details
Closed on
May 1, 2008
Sold by
Calkins Sandra S
Bought by
Int Calkins Sandra S
Create a Home Valuation Report for This Property
The Home Valuation Report is an in-depth analysis detailing your home's value as well as a comparison with similar homes in the area
Purchase History
| Date | Buyer | Sale Price | Title Company |
|---|---|---|---|
| Sandra S Calkins Revocable Inter Vivos Trust | -- | Corporon Law Office | |
| Robert L Calkins Separate Property Trust | -- | -- | |
| Calkins Robert L | -- | None Available | |
| Int Calkins Sandra S | -- | None Available |
Source: Public Records
Tax History
| Year | Tax Paid | Tax Assessment Tax Assessment Total Assessment is a certain percentage of the fair market value that is determined by local assessors to be the total taxable value of land and additions on the property. | Land | Improvement |
|---|---|---|---|---|
| 2025 | $859 | $74,959 | $11,743 | $63,216 |
| 2024 | $859 | $73,490 | $11,513 | $61,977 |
| 2023 | $834 | $72,050 | $11,288 | $60,762 |
| 2022 | $822 | $70,638 | $11,067 | $59,571 |
| 2021 | $753 | $69,253 | $10,850 | $58,403 |
| 2020 | $752 | $68,544 | $10,739 | $57,805 |
| 2019 | $745 | $67,201 | $10,529 | $56,672 |
| 2018 | $698 | $65,884 | $10,323 | $55,561 |
| 2017 | $720 | $64,593 | $10,121 | $54,472 |
| 2016 | $677 | $63,327 | $9,923 | $53,404 |
| 2015 | $666 | $62,376 | $9,774 | $52,602 |
| 2014 | $652 | $61,155 | $9,583 | $51,572 |
Source: Public Records
Map
Nearby Homes
- 303 Colusa St
- 17 E Colusa St
- 929 3rd St
- 65 E Colusa St
- 919 East St
- 736 8th St
- 100 Frances Ln
- 246 E Shasta St
- 1019 W Monterey St
- 906 Almond Way
- 329 Byron Way
- 325 Byron Way
- 634 Salomon Dr
- 346 Stanton Way
- 6400 County Road Hh
- 0 Hoff Way
- 4426 Commerce Ln
- 1158 Hoff Way
- 327 Yuba St
- 0 South St Unit SN23178337
Your Personal Tour Guide
Ask me questions while you tour the home.