522 Alabama St Vallejo, CA 94590
Saint Vincent's Hill NeighborhoodEstimated Value: $354,000 - $397,316
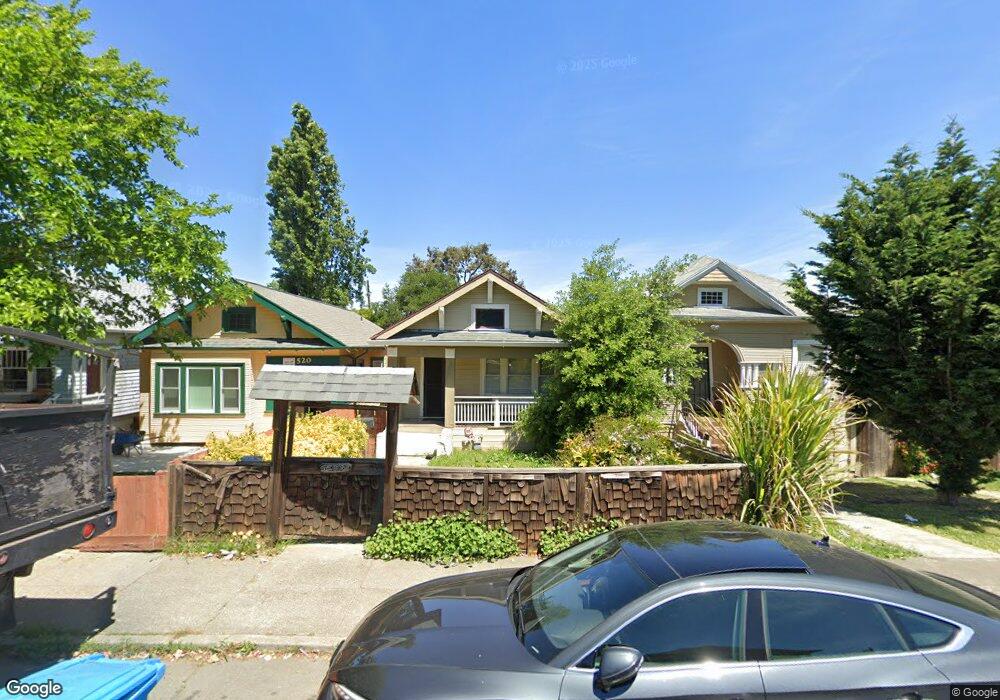
About This Home
This home is located at 522 Alabama St, Vallejo, CA 94590 and is currently estimated at $372,829, approximately $396 per square foot. 522 Alabama St is a home located in Solano County with nearby schools including Mare Island Health And Fitness Academy, Vallejo High School, and Caliber: ChangeMakers Academy.
Ownership History
We collect this data history from publicly available records. To have your information removed, we recommend requesting removal directly through your county’s website.
Purchase Details
Purchase Details
Purchase Details
Purchase Details
Purchase Details
Home Financials for this Owner
Home Financials are based on the most recent Mortgage that was taken out on this home.Purchase Details
Home Values in the Area
Average Home Value in this Area
Purchase History
We collect this data history from publicly available records. To have your information removed, we recommend requesting removal directly through your county’s website.
| Date | Buyer | Sale Price | Title Company |
|---|---|---|---|
| $115,000 | Old Republic Title Co | ||
| -- | None Available | ||
| $42,000 | Chicago Title Company | ||
| $295,800 | None Available | ||
| -- | Frontier Title Company | ||
| -- | First American Title Guarant |
Mortgage History
We collect this data history from publicly available records. To have your information removed, we recommend requesting removal directly through your county’s website.
| Date | Status | Borrower | Loan Amount |
|---|---|---|---|
| Previous Owner | $140,000 |
Tax History
We collect this data history from publicly available records. To have your information removed, we recommend requesting removal directly through your county’s website.
| Year | Tax Paid | Tax Assessment Tax Assessment Total Assessment is a certain percentage of the fair market value that is determined by local assessors to be the total taxable value of land and additions on the property. | Land | Improvement |
|---|---|---|---|---|
| 2025 | $4,287 | $284,453 | $85,335 | $199,118 |
| 2024 | $4,287 | $278,876 | $83,662 | $195,214 |
| 2023 | $4,034 | $273,409 | $82,022 | $191,387 |
| 2022 | $3,939 | $268,049 | $80,414 | $187,635 |
| 2021 | $3,852 | $262,794 | $78,838 | $183,956 |
| 2020 | $3,867 | $260,100 | $78,030 | $182,070 |
| 2019 | $3,748 | $255,000 | $76,500 | $178,500 |
| 2018 | $1,668 | $87,143 | $22,633 | $64,510 |
| 2017 | $2,710 | $85,436 | $22,190 | $63,246 |
| 2016 | $2,274 | $83,761 | $21,755 | $62,006 |
| 2015 | $2,237 | $82,504 | $21,429 | $61,075 |
| 2014 | $2,049 | $80,889 | $21,010 | $59,879 |
Map
- 1511 Marin St
- 2609 Sonoma Blvd
- 1209 Sacramento St
- 1319 Sacramento St
- 2104 Marin St
- 1821 Marin St
- 432 Ohio St
- 620 Kentucky St
- 1524 Sutter St
- 908 Kentucky St
- 902 Kentucky St
- 729 Ohio St
- 212 Illinois St
- 314 Ohio St
- 1810 Sutter St
- 1513 Santa Clara St
- 308 Florida St
- 1244 El Dorado
- 1117 El Dorado
- 5 Santa Paula Way
- 1330 Marin St
- 1332 Marin St
- 1320 Marin St
- 515 Alabama St
- 519 Alabama St
- 600 Louisiana St
- 614 Louisiana St
- 527 Alabama St
- 606 Louisiana St
- 508 Alabama St
- 514 Alabama St
- 518 Alabama St
- 624 Louisiana St
- 531 Alabama St
- 520 Alabama St
- 628 Louisiana St
- 524 Alabama St
- 630 Louisiana St
- 636 Louisiana St
- 426 Alabama St
Ask me questions while you tour the home.