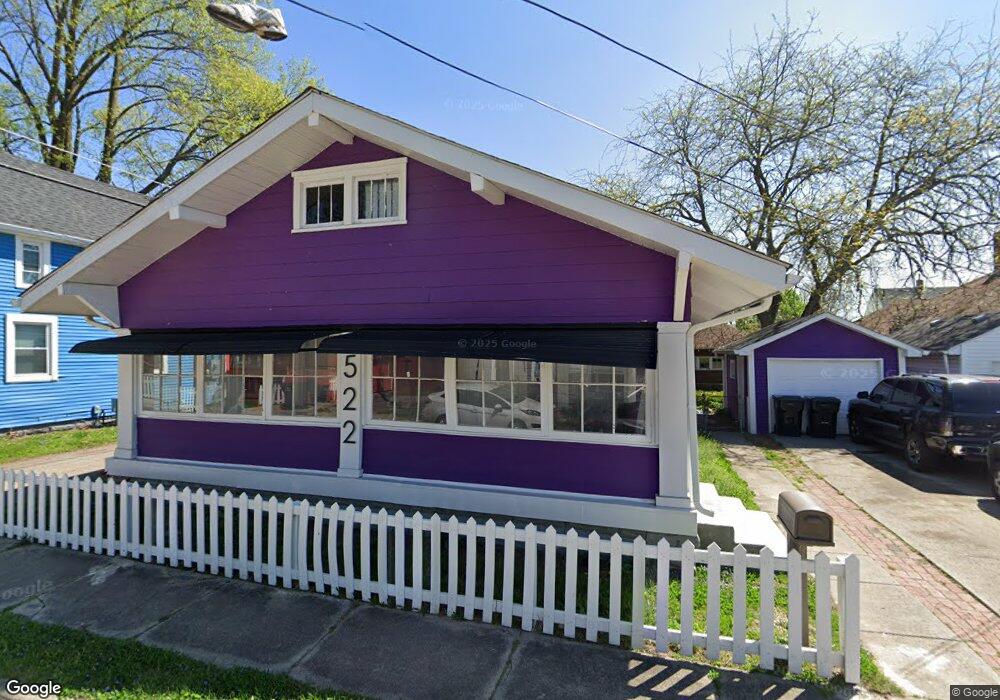
522 Chase St Anderson, IN 46016
Estimated Value: $57,000 - $118,000
2
Beds
1
Bath
1,208
Sq Ft
$65/Sq Ft
Est. Value
About This Home
This home is located at 522 Chase St, Anderson, IN 46016 and is currently estimated at $78,723, approximately $65 per square foot. 522 Chase St is a home located in Madison County with nearby schools including Eastside Elementary School, Highland Middle School, and Anderson High School.
Ownership History
Date
Name
Owned For
Owner Type
Purchase Details
Closed on
Feb 13, 2024
Sold by
Euporia Llc
Bought by
Osorio Jennifer Yurani Pinzo
Current Estimated Value
Purchase Details
Closed on
Jan 24, 2024
Sold by
Picket Fence Property Company
Bought by
Euporia Llc
Purchase Details
Closed on
Dec 28, 2023
Sold by
Picket Fence Property Company
Bought by
Euphoria Llc
Purchase Details
Closed on
Aug 9, 2023
Sold by
Hannaford Andrew and Hannaford Yonda
Bought by
Picket Fence Property Company
Create a Home Valuation Report for This Property
The Home Valuation Report is an in-depth analysis detailing your home's value as well as a comparison with similar homes in the area
Home Values in the Area
Average Home Value in this Area
Purchase History
| Date | Buyer | Sale Price | Title Company |
|---|---|---|---|
| Osorio Jennifer Yurani Pinzo | -- | None Listed On Document | |
| Euporia Llc | -- | None Listed On Document | |
| Euphoria Llc | $75,000 | None Listed On Document | |
| Picket Fence Property Company | $35,000 | None Listed On Document |
Source: Public Records
Tax History Compared to Growth
Tax History
| Year | Tax Paid | Tax Assessment Tax Assessment Total Assessment is a certain percentage of the fair market value that is determined by local assessors to be the total taxable value of land and additions on the property. | Land | Improvement |
|---|---|---|---|---|
| 2024 | $527 | $23,700 | $5,800 | $17,900 |
| 2023 | $490 | $21,900 | $5,500 | $16,400 |
| 2022 | $481 | $21,500 | $5,200 | $16,300 |
| 2021 | $446 | $19,800 | $5,200 | $14,600 |
| 2020 | $425 | $18,800 | $4,900 | $13,900 |
| 2019 | $418 | $18,500 | $4,900 | $13,600 |
| 2018 | $399 | $17,300 | $4,900 | $12,400 |
| 2017 | $342 | $17,100 | $4,900 | $12,200 |
| 2016 | $342 | $17,100 | $4,900 | $12,200 |
| 2014 | $346 | $17,300 | $5,000 | $12,300 |
| 2013 | $346 | $19,000 | $5,000 | $14,000 |
Source: Public Records
Map
Nearby Homes