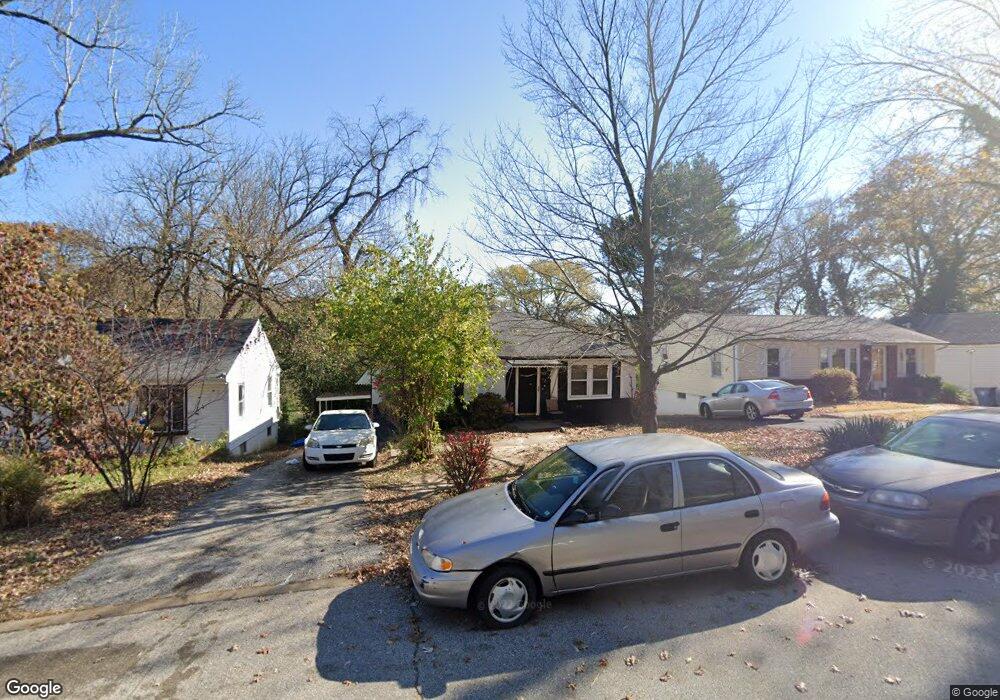
522 Coppinger Dr Saint Louis, MO 63135
Estimated Value: $122,000 - $149,000
4
Beds
2
Baths
1,390
Sq Ft
$98/Sq Ft
Est. Value
About This Home
This home is located at 522 Coppinger Dr, Saint Louis, MO 63135 and is currently estimated at $135,924, approximately $97 per square foot. 522 Coppinger Dr is a home located in St. Louis County with nearby schools including Lee Hamilton Elementary School, Ferguson Middle School, and McCluer High School.
Ownership History
Date
Name
Owned For
Owner Type
Purchase Details
Closed on
Oct 23, 2023
Sold by
Simmons Evalean
Bought by
Simmons Terry L
Current Estimated Value
Purchase Details
Closed on
Nov 29, 2011
Sold by
Federal Home Loan Mortgage Corporation
Bought by
Simmons Evalean
Purchase Details
Closed on
Jan 31, 2011
Sold by
Campbell Dennis Lee and Campbell Dennis Lee
Bought by
Federal Home Loan Mortgage Corp
Purchase Details
Closed on
Feb 1, 2008
Sold by
Preferred Homebuyers Llc
Bought by
Campbell Dennis Lee and Campbell Chritine G
Home Financials for this Owner
Home Financials are based on the most recent Mortgage that was taken out on this home.
Original Mortgage
$73,150
Interest Rate
6.07%
Mortgage Type
Purchase Money Mortgage
Purchase Details
Closed on
Sep 19, 2007
Sold by
Lederman Mary Ann
Bought by
Preferred Home Buyers
Create a Home Valuation Report for This Property
The Home Valuation Report is an in-depth analysis detailing your home's value as well as a comparison with similar homes in the area
Home Values in the Area
Average Home Value in this Area
Purchase History
| Date | Buyer | Sale Price | Title Company |
|---|---|---|---|
| Simmons Terry L | -- | None Listed On Document | |
| Simmons Evalean | $36,000 | Stewart Title | |
| Federal Home Loan Mortgage Corp | $60,181 | None Available | |
| Campbell Dennis Lee | $52,000 | None Available | |
| Preferred Home Buyers | $43,000 | Ort |
Source: Public Records
Mortgage History
| Date | Status | Borrower | Loan Amount |
|---|---|---|---|
| Previous Owner | Campbell Dennis Lee | $73,150 |
Source: Public Records
Tax History Compared to Growth
Tax History
| Year | Tax Paid | Tax Assessment Tax Assessment Total Assessment is a certain percentage of the fair market value that is determined by local assessors to be the total taxable value of land and additions on the property. | Land | Improvement |
|---|---|---|---|---|
| 2025 | $1,754 | $27,630 | $2,380 | $25,250 |
| 2024 | $1,754 | $24,210 | $1,580 | $22,630 |
| 2023 | $1,744 | $24,210 | $1,580 | $22,630 |
| 2022 | $1,590 | $19,210 | $2,720 | $16,490 |
| 2021 | $1,539 | $19,210 | $2,720 | $16,490 |
| 2020 | $1,426 | $15,980 | $2,760 | $13,220 |
| 2019 | $1,399 | $15,980 | $2,760 | $13,220 |
| 2018 | $1,230 | $12,500 | $2,390 | $10,110 |
| 2017 | $1,206 | $12,500 | $2,390 | $10,110 |
| 2016 | $1,154 | $11,760 | $2,010 | $9,750 |
| 2015 | $1,162 | $11,760 | $2,010 | $9,750 |
| 2014 | $1,049 | $10,470 | $2,470 | $8,000 |
Source: Public Records
Map
Nearby Homes
- 514 La Motte Ln
- 539 Coppinger Dr
- 818 Robert Ave
- 408 Coppinger Dr
- 324 Ames Place
- 506 Averill Ave
- 610 Superior Dr
- 315 Coppinger Dr
- 310 Ames Place
- 208 Coppinger Dr
- 931 Thatcher Ave
- 418 Millman Dr
- 406 Teston Dr
- 405 Teston Dr
- 925 Dyerdown Ave
- 410 Argent Ave
- 1209 Chambers Rd
- 339 Wedge Dr
- 941 N Elizabeth Ave
- 429 N Clay Ave
- 524 Coppinger Dr
- 516 Coppinger Dr
- 512 Coppinger Dr
- 532 Coppinger Dr
- 517 La Motte Ln
- 508 Coppinger Dr
- 529 La Motte Ln
- 509 La Motte Ln
- 519 Coppinger Dr
- 523 Coppinger Dr
- 515 Coppinger Dr
- 536 Coppinger Dr
- 502 Coppinger Dr
- 505 La Motte Ln
- 531 La Motte Ln
- 527 Coppinger Dr
- 511 Coppinger Dr
- 531 Coppinger Dr
- 540 Coppinger Dr
- 420 Coppinger Dr