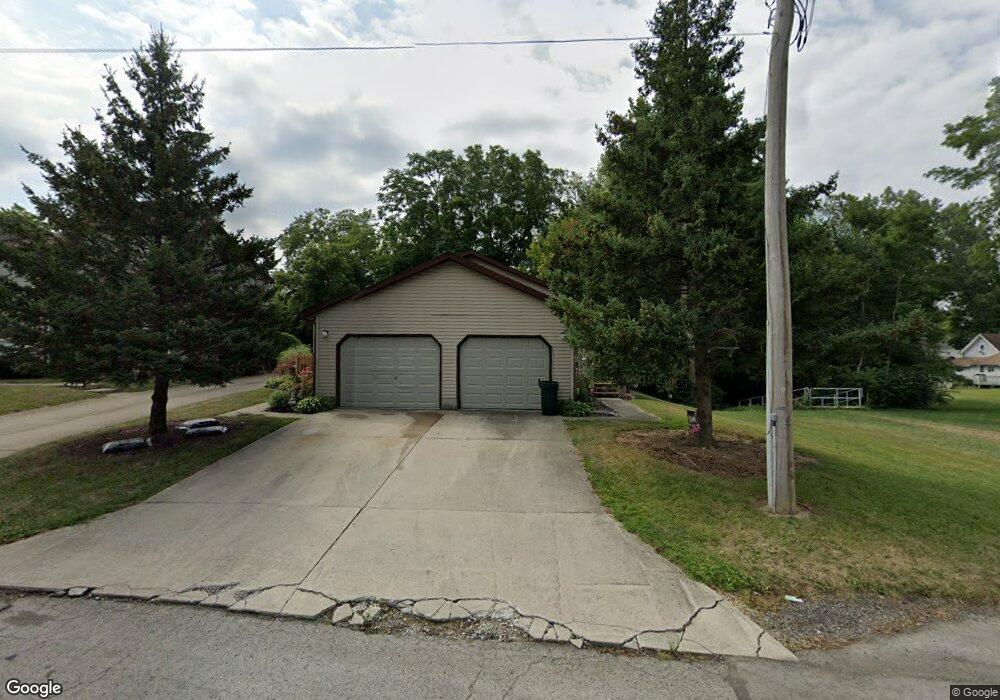
522 E High Ave Bellefontaine, OH 43311
Estimated Value: $151,000 - $229,027
4
Beds
2
Baths
1,936
Sq Ft
$96/Sq Ft
Est. Value
About This Home
This home is located at 522 E High Ave, Bellefontaine, OH 43311 and is currently estimated at $185,257, approximately $95 per square foot. 522 E High Ave is a home located in Logan County with nearby schools including Bellefontaine Elementary School, Bellefontaine Intermediate School, and Bellefontaine Middle School.
Ownership History
Date
Name
Owned For
Owner Type
Purchase Details
Closed on
Dec 3, 2018
Sold by
Hankins Jeremy G and Hankins Kimberly S
Bought by
Hankins Investments Llc
Current Estimated Value
Purchase Details
Closed on
Aug 25, 2016
Sold by
Hankins Jeremy G
Bought by
Hankins Jeremy G and Hankins Kimberly S
Home Financials for this Owner
Home Financials are based on the most recent Mortgage that was taken out on this home.
Original Mortgage
$106,000
Interest Rate
3.42%
Mortgage Type
New Conventional
Purchase Details
Closed on
Jul 1, 2008
Bought by
Hankins Jeremy G
Purchase Details
Closed on
Mar 4, 2005
Bought by
Hornish Roxann E Trustee
Purchase Details
Closed on
Oct 29, 2002
Bought by
Fissel Roger A
Purchase Details
Closed on
Jan 29, 2002
Bought by
Firstar Bank Na
Purchase Details
Closed on
Jan 25, 1999
Bought by
Mcclanahan Matthew D
Purchase Details
Closed on
Jan 5, 1999
Bought by
Mcclanahan Matthew P
Create a Home Valuation Report for This Property
The Home Valuation Report is an in-depth analysis detailing your home's value as well as a comparison with similar homes in the area
Home Values in the Area
Average Home Value in this Area
Purchase History
| Date | Buyer | Sale Price | Title Company |
|---|---|---|---|
| Hankins Investments Llc | -- | None Available | |
| Hankins Jeremy G | -- | None Available | |
| Hankins Jeremy G | $133,500 | -- | |
| Hornish Roxann E Trustee | $118,000 | -- | |
| Fissel Roger A | -- | -- | |
| Firstar Bank Na | $100,000 | -- | |
| Mcclanahan Matthew D | -- | -- | |
| Mcclanahan Matthew P | $104,500 | -- |
Source: Public Records
Mortgage History
| Date | Status | Borrower | Loan Amount |
|---|---|---|---|
| Previous Owner | Hankins Jeremy G | $106,000 |
Source: Public Records
Tax History Compared to Growth
Tax History
| Year | Tax Paid | Tax Assessment Tax Assessment Total Assessment is a certain percentage of the fair market value that is determined by local assessors to be the total taxable value of land and additions on the property. | Land | Improvement |
|---|---|---|---|---|
| 2024 | $2,176 | $54,020 | $9,450 | $44,570 |
| 2023 | $2,176 | $54,020 | $9,450 | $44,570 |
| 2022 | $2,328 | $45,020 | $7,880 | $37,140 |
| 2021 | $2,046 | $45,020 | $7,880 | $37,140 |
| 2020 | $2,048 | $36,950 | $5,390 | $31,560 |
| 2019 | $2,092 | $36,950 | $5,390 | $31,560 |
| 2018 | $1,456 | $36,950 | $5,390 | $31,560 |
| 2016 | $1,435 | $34,080 | $5,390 | $28,690 |
| 2014 | $1,364 | $34,080 | $5,390 | $28,690 |
| 2013 | $1,364 | $34,080 | $5,390 | $28,690 |
| 2012 | $1,631 | $41,790 | $5,390 | $36,400 |
Source: Public Records
Map
Nearby Homes
- 520 E Sandusky Ave
- 631 Oakland Ave
- 305 N Park St
- 632 Oakland Ave
- 315 Linden St
- 312 Irving Ave
- 313 Irving Ave
- 312 E Columbus Ave
- 1008 N Park St
- 325 E Chillicothe Ave
- 549 E Chillicothe Ave
- 500 E Chillicothe Ave
- 1305 Dakota Rd
- 0 Ashbrook Dr
- 432 N Detroit St
- 324 N Detroit St
- 612 N Detroit St
- 401 N Detroit St
- 208 W Williams Ave
- 612 Hillcrest Dr