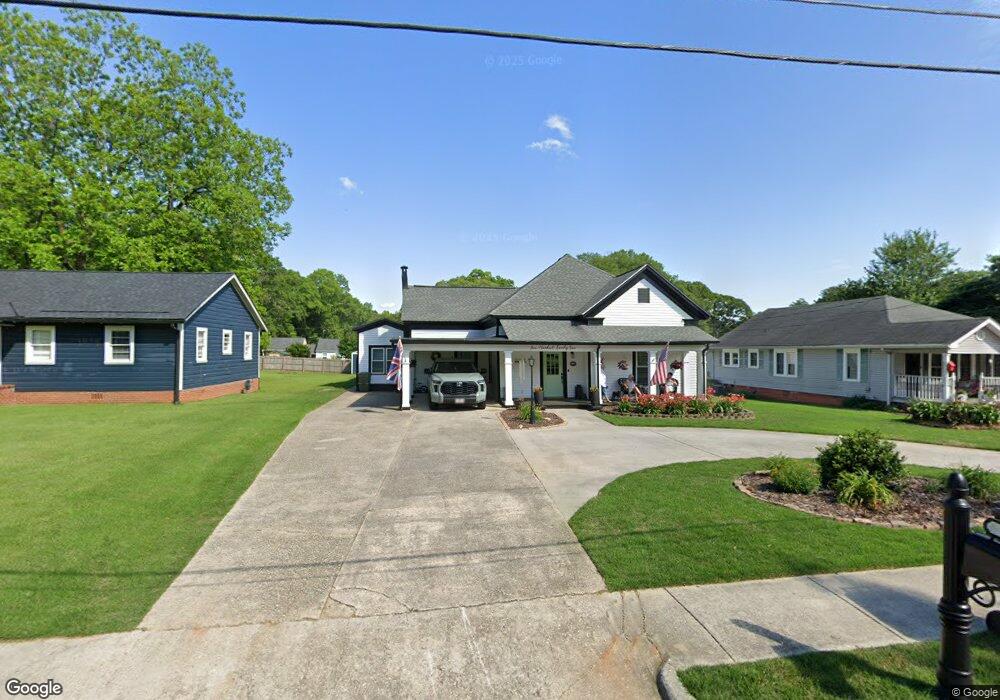
522 Longview St Carrollton, GA 30117
Estimated Value: $430,252 - $453,000
4
Beds
2
Baths
2,368
Sq Ft
$188/Sq Ft
Est. Value
About This Home
This home is located at 522 Longview St, Carrollton, GA 30117 and is currently estimated at $444,313, approximately $187 per square foot. 522 Longview St is a home located in Carroll County with nearby schools including Carrollton Elementary School, Carrollton Upper Elementary School, and Carrollton Middle School.
Ownership History
Date
Name
Owned For
Owner Type
Purchase Details
Closed on
Apr 9, 2021
Sold by
Swafford Sonya Gilland
Bought by
Bird David R and Bird Susan E
Current Estimated Value
Home Financials for this Owner
Home Financials are based on the most recent Mortgage that was taken out on this home.
Original Mortgage
$180,000
Outstanding Balance
$135,246
Interest Rate
3.05%
Mortgage Type
New Conventional
Estimated Equity
$309,067
Purchase Details
Closed on
Jul 2, 2019
Sold by
Alsip Clayton H
Bought by
Swafford Sonya Gilland
Home Financials for this Owner
Home Financials are based on the most recent Mortgage that was taken out on this home.
Original Mortgage
$128,000
Interest Rate
3.82%
Mortgage Type
New Conventional
Purchase Details
Closed on
Jun 27, 2001
Sold by
Jordan Verna
Bought by
Alsip Clayton H
Purchase Details
Closed on
Aug 25, 2000
Sold by
Jordon Jordon F and Jordon Borders S
Bought by
Jordan Verna
Purchase Details
Closed on
Sep 6, 1983
Bought by
Jordon Jordon F and Jordon Borders S
Create a Home Valuation Report for This Property
The Home Valuation Report is an in-depth analysis detailing your home's value as well as a comparison with similar homes in the area
Home Values in the Area
Average Home Value in this Area
Purchase History
| Date | Buyer | Sale Price | Title Company |
|---|---|---|---|
| Bird David R | $325,000 | -- | |
| Swafford Sonya Gilland | $160,000 | -- | |
| Alsip Clayton H | $95,300 | -- | |
| Jordan Verna | $95,900 | -- | |
| Jordon Jordon F | $66,000 | -- |
Source: Public Records
Mortgage History
| Date | Status | Borrower | Loan Amount |
|---|---|---|---|
| Open | Bird David R | $180,000 | |
| Previous Owner | Swafford Sonya Gilland | $128,000 |
Source: Public Records
Tax History Compared to Growth
Tax History
| Year | Tax Paid | Tax Assessment Tax Assessment Total Assessment is a certain percentage of the fair market value that is determined by local assessors to be the total taxable value of land and additions on the property. | Land | Improvement |
|---|---|---|---|---|
| 2024 | $4,251 | $166,504 | $21,888 | $144,616 |
| 2023 | $4,251 | $154,600 | $21,888 | $132,712 |
| 2022 | $3,235 | $114,842 | $14,592 | $100,250 |
| 2021 | $2,843 | $97,386 | $10,800 | $86,586 |
| 2020 | $1,391 | $47,590 | $10,800 | $36,790 |
| 2019 | $1,320 | $44,747 | $10,800 | $33,947 |
| 2018 | $1,141 | $38,130 | $9,737 | $28,393 |
| 2017 | $1,272 | $38,130 | $9,737 | $28,393 |
| 2016 | $1,088 | $42,292 | $10,800 | $31,492 |
| 2015 | $1,109 | $35,900 | $4,800 | $31,101 |
| 2014 | $1,114 | $35,901 | $4,800 | $31,101 |
Source: Public Records
Map
Nearby Homes
- 516 Longview St
- 219 Broad St
- 0 Hwy 27 None N
- 105 Haygood Place
- 160 Watson St
- 27 South St
- 141 Bowen St
- 142 Griffin Dr
- 109 S Park St
- 301 Bradley St
- 301 C4 Bradley St
- 117 Orion Terrace
- 110 Golfview Ct
- 166 Maple St
- 308 Old Mill Dr
- 423 Clifton Terrace
- TRACT1-7 Us Highway 27
- 105 Mara St
- 205 Johnson Ave Unit 231
- 98 Millstream Ct
- 518 Longview St
- 528 Longview St
- 0 Longview St Unit 7378021
- 0 Longview St Unit 8827486
- 0 Longview St Unit 3128153
- 0 Longview St Unit 7236830
- 0 Longview St Unit 7537426
- 0 Longview St Unit 7637235
- 0 Longview St Unit 8263510
- 0 Longview St Unit 8495740
- 0 Longview St Unit 8660413
- 0 Longview St Unit 8684070
- 000 Longview St
- 602 Longview St
- 209 Carroll St
- 205 Carroll St
- 201 Carroll St
- 519 Longview St
- 606 Longview St
- 601 Longview St