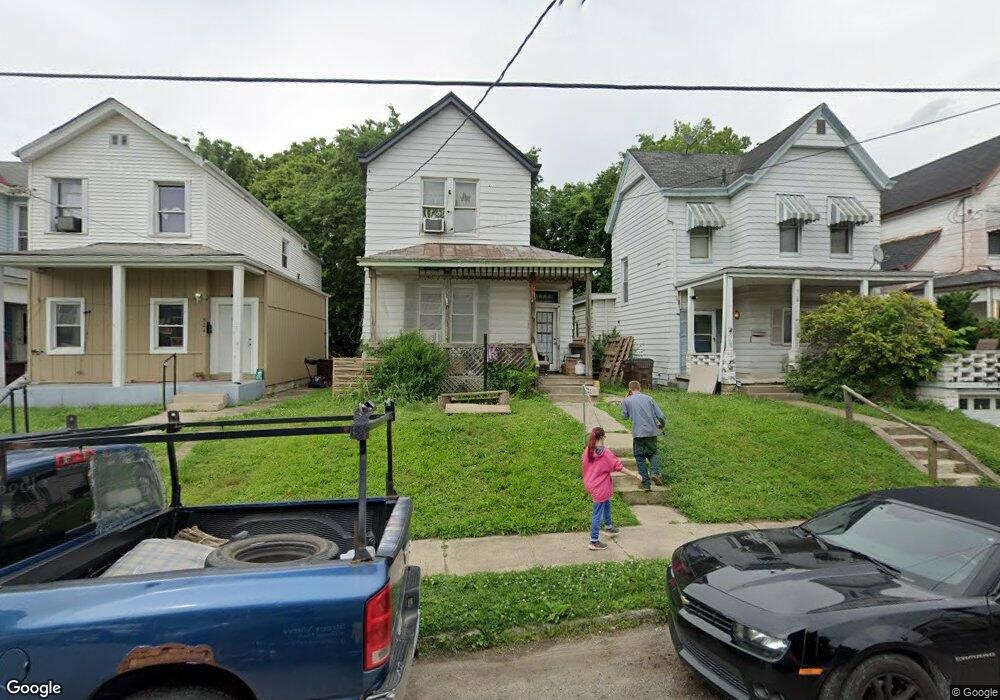
522 Maple St Cincinnati, OH 45216
Estimated Value: $118,156 - $160,000
2
Beds
2
Baths
1,687
Sq Ft
$88/Sq Ft
Est. Value
About This Home
This home is located at 522 Maple St, Cincinnati, OH 45216 and is currently estimated at $148,039, approximately $87 per square foot. 522 Maple St is a home located in Hamilton County with nearby schools including Elmwood Place Elementary School, St Bernard-Elmwood Place High School, and Regeneration Bond Hill.
Ownership History
Date
Name
Owned For
Owner Type
Purchase Details
Closed on
May 22, 2020
Sold by
Jordan Nathan and Spahr Brandy
Bought by
Jordan & Jordan Properties Llc
Current Estimated Value
Purchase Details
Closed on
Feb 17, 2004
Sold by
Federal Home Loan Mortgage Corporation
Bought by
Jordan Nathan
Purchase Details
Closed on
Feb 3, 2004
Sold by
Washington Mutual Bank Fa
Bought by
Federal Home Loan Mortgage Corporation
Purchase Details
Closed on
Feb 28, 2003
Sold by
Chandler Joe and Chandler Kelly
Bought by
Washington Mutual Bank Fa and Pnc Mortgage Corp
Purchase Details
Closed on
Nov 10, 1997
Sold by
Gee David R and Holliday Connie L
Bought by
Keim Robert and 522 Maple Land Trust
Create a Home Valuation Report for This Property
The Home Valuation Report is an in-depth analysis detailing your home's value as well as a comparison with similar homes in the area
Home Values in the Area
Average Home Value in this Area
Purchase History
| Date | Buyer | Sale Price | Title Company |
|---|---|---|---|
| Jordan & Jordan Properties Llc | -- | None Available | |
| Jordan Nathan | -- | -- | |
| Federal Home Loan Mortgage Corporation | -- | -- | |
| Washington Mutual Bank Fa | $36,000 | -- | |
| Keim Robert | -- | -- |
Source: Public Records
Tax History
| Year | Tax Paid | Tax Assessment Tax Assessment Total Assessment is a certain percentage of the fair market value that is determined by local assessors to be the total taxable value of land and additions on the property. | Land | Improvement |
|---|---|---|---|---|
| 2025 | $1,391 | $19,338 | $3,213 | $16,125 |
| 2023 | $1,402 | $19,338 | $3,213 | $16,125 |
| 2022 | $1,034 | $10,507 | $2,569 | $7,938 |
| 2021 | $941 | $10,507 | $2,569 | $7,938 |
| 2020 | $910 | $10,507 | $2,569 | $7,938 |
| 2019 | $979 | $10,507 | $2,569 | $7,938 |
| 2018 | $993 | $10,507 | $2,569 | $7,938 |
| 2017 | $936 | $10,507 | $2,569 | $7,938 |
| 2016 | $828 | $9,240 | $2,961 | $6,279 |
| 2015 | $775 | $9,240 | $2,961 | $6,279 |
| 2014 | $773 | $9,240 | $2,961 | $6,279 |
| 2013 | $819 | $10,045 | $3,220 | $6,825 |
Source: Public Records
Map
Nearby Homes
- 524 Maple St
- 121 64th St
- 107 W Sixty Fifth St
- 412 Walnut St
- 6310 Vine St
- 302 Walnut St
- 215 Walnut St
- 5914 Elmwood Ave
- 1 Spruce St
- 6605 Hasler Ln
- 206 W 69th St
- 14 Township Ave
- 0 Township Road 111
- 1139 Towanda Terrace
- 120 W Seventy Second St
- 3 W 73rd St
- 118 W North Bend Rd
- 1117 W Seymour Ave
- 1100 Carolina Ave
- 1144 Carolina Ave
Your Personal Tour Guide
Ask me questions while you tour the home.