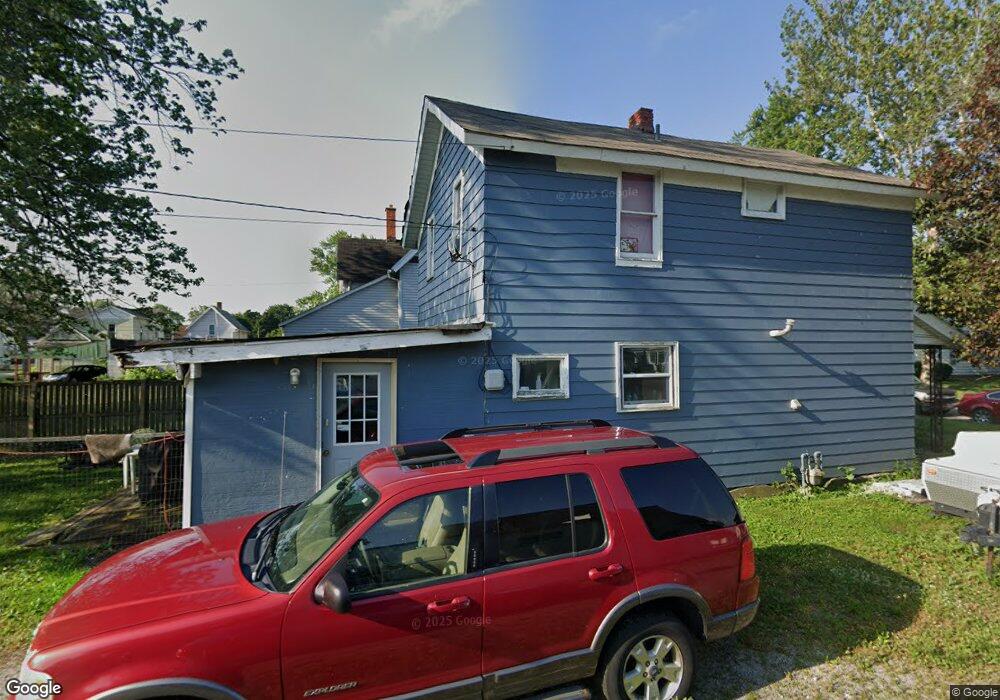
522 Maple St Fostoria, OH 44830
Estimated Value: $116,000 - $128,000
3
Beds
2
Baths
1,232
Sq Ft
$98/Sq Ft
Est. Value
About This Home
This home is located at 522 Maple St, Fostoria, OH 44830 and is currently estimated at $120,618, approximately $97 per square foot. 522 Maple St is a home located in Seneca County with nearby schools including Fostoria Intermediate Elementary School and Fostoria Junior/Senior High School.
Ownership History
Date
Name
Owned For
Owner Type
Purchase Details
Closed on
Mar 7, 2013
Sold by
Alexander Patrick W and Alexander Donna Renee
Bought by
Lockmiller Kathryn
Current Estimated Value
Purchase Details
Closed on
Jan 7, 2011
Sold by
Johnson Evelyn Sue
Bought by
Alexander Patrick W and Alexander Donna Renee
Purchase Details
Closed on
Jan 6, 2011
Sold by
Zimmerman Clara and Zimmerman Sheridan W
Bought by
Flores Mercedes O
Purchase Details
Closed on
Jan 1, 2011
Sold by
Durst Brandon A
Bought by
Martinez Chloe
Purchase Details
Closed on
Oct 30, 1998
Sold by
Chamberlain Barbara
Bought by
Flores Mercedes O
Purchase Details
Closed on
Oct 18, 1995
Sold by
Fillhart Ruth D and Fillhart Barbara
Bought by
Chamberlain Barbara
Purchase Details
Closed on
May 11, 1995
Bought by
Fillhart Ruth D and Fillhart Barbara
Purchase Details
Closed on
Sep 19, 1994
Sold by
Fillhart Harry C
Bought by
Fillhart Harry C and Fillhart Barbara
Create a Home Valuation Report for This Property
The Home Valuation Report is an in-depth analysis detailing your home's value as well as a comparison with similar homes in the area
Home Values in the Area
Average Home Value in this Area
Purchase History
| Date | Buyer | Sale Price | Title Company |
|---|---|---|---|
| Lockmiller Kathryn | $1,200 | None Available | |
| Alexander Patrick W | -- | Mid American Title Agency In | |
| Johnson Evelyn Sue | $19,900 | Mid American Title Agency In | |
| Flores Mercedes O | -- | Mid American Title Agency In | |
| Martinez Chloe | -- | Mid American Title Agency In | |
| Flores Mercedes O | $42,900 | -- | |
| Chamberlain Barbara | -- | -- | |
| Fillhart Ruth D | -- | -- | |
| Fillhart Harry C | -- | -- |
Source: Public Records
Tax History Compared to Growth
Tax History
| Year | Tax Paid | Tax Assessment Tax Assessment Total Assessment is a certain percentage of the fair market value that is determined by local assessors to be the total taxable value of land and additions on the property. | Land | Improvement |
|---|---|---|---|---|
| 2024 | $1,412 | $26,030 | $4,740 | $21,290 |
| 2023 | $1,410 | $26,030 | $4,740 | $21,290 |
| 2022 | $1,233 | $20,050 | $3,930 | $16,120 |
| 2021 | $1,258 | $20,050 | $3,930 | $16,120 |
| 2020 | $1,425 | $20,048 | $3,927 | $16,121 |
| 2019 | $1,231 | $19,352 | $3,791 | $15,561 |
| 2018 | $1,253 | $19,352 | $3,791 | $15,561 |
| 2017 | $1,218 | $18,782 | $3,791 | $14,991 |
| 2016 | $955 | $16,125 | $4,039 | $12,086 |
| 2015 | $1,994 | $16,125 | $4,039 | $12,086 |
| 2014 | $949 | $16,125 | $4,039 | $12,086 |
| 2013 | $1,037 | $17,528 | $4,389 | $13,139 |
Source: Public Records
Map
Nearby Homes
- 540 N Poplar St
- 220 E High St
- 633 Maple St
- 321 Mcdougal St
- 520 N Union St
- 723 N Union St
- 412 E Center St
- 711 Circle Dr
- 827 Buckley St
- 203 N Union St
- 931 N Union St
- 133 E South St
- 481 Beverly Dr
- 0 W South Route 12
- 207 W Culbertson St
- 892 N Countyline St
- 900 N Countyline St
- 429 S Town St
- 348 W South St
- 509 College Ave