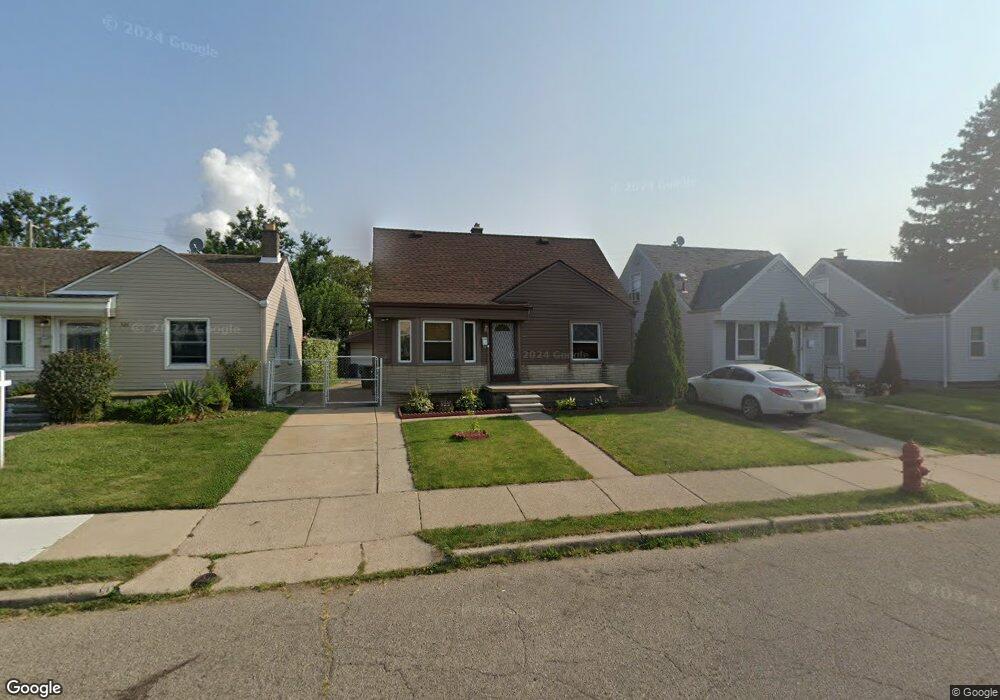
522 Mill St Lincoln Park, MI 48146
Estimated Value: $149,000 - $168,000
3
Beds
1
Bath
1,115
Sq Ft
$144/Sq Ft
Est. Value
About This Home
This home is located at 522 Mill St, Lincoln Park, MI 48146 and is currently estimated at $160,616, approximately $144 per square foot. 522 Mill St is a home located in Wayne County with nearby schools including Keppen School, Lincoln Park Middle School, and Lincoln Park High School.
Ownership History
Date
Name
Owned For
Owner Type
Purchase Details
Closed on
Feb 11, 2021
Sold by
Poole Kristopher A
Bought by
Garner Michelle
Current Estimated Value
Purchase Details
Closed on
Aug 7, 2020
Sold by
Poole Kristopher A and Estate Of Kenneth Allen Poole
Bought by
Poole Kristopher A
Purchase Details
Closed on
Feb 18, 2011
Sold by
Fedea Christina N
Bought by
Poole Kristopher and Poole Tiffany
Purchase Details
Closed on
Jan 16, 2003
Sold by
Poole Sandra Lee
Bought by
Poole Kenneth Allen
Create a Home Valuation Report for This Property
The Home Valuation Report is an in-depth analysis detailing your home's value as well as a comparison with similar homes in the area
Home Values in the Area
Average Home Value in this Area
Purchase History
| Date | Buyer | Sale Price | Title Company |
|---|---|---|---|
| Garner Michelle | $120,000 | Leading Edge Title Agency | |
| Poole Kristopher A | -- | None Available | |
| Poole Kristopher | $48,000 | Select Title Company | |
| Poole Kenneth Allen | -- | Alpha Title Agency Inc |
Source: Public Records
Tax History Compared to Growth
Tax History
| Year | Tax Paid | Tax Assessment Tax Assessment Total Assessment is a certain percentage of the fair market value that is determined by local assessors to be the total taxable value of land and additions on the property. | Land | Improvement |
|---|---|---|---|---|
| 2025 | $1,913 | $60,300 | $0 | $0 |
| 2024 | $1,913 | $53,100 | $0 | $0 |
| 2023 | $1,813 | $48,900 | $0 | $0 |
| 2022 | $2,145 | $39,900 | $0 | $0 |
| 2021 | $1,403 | $38,500 | $0 | $0 |
| 2020 | $1,391 | $30,700 | $0 | $0 |
| 2019 | $1,098 | $27,100 | $0 | $0 |
| 2018 | $989 | $25,300 | $0 | $0 |
| 2017 | $741 | $23,600 | $0 | $0 |
| 2016 | $1,294 | $24,300 | $0 | $0 |
| 2015 | $2,380 | $23,800 | $0 | $0 |
| 2013 | $2,450 | $25,600 | $0 | $0 |
| 2012 | $1,513 | $26,400 | $5,500 | $20,900 |
Source: Public Records
Map
Nearby Homes