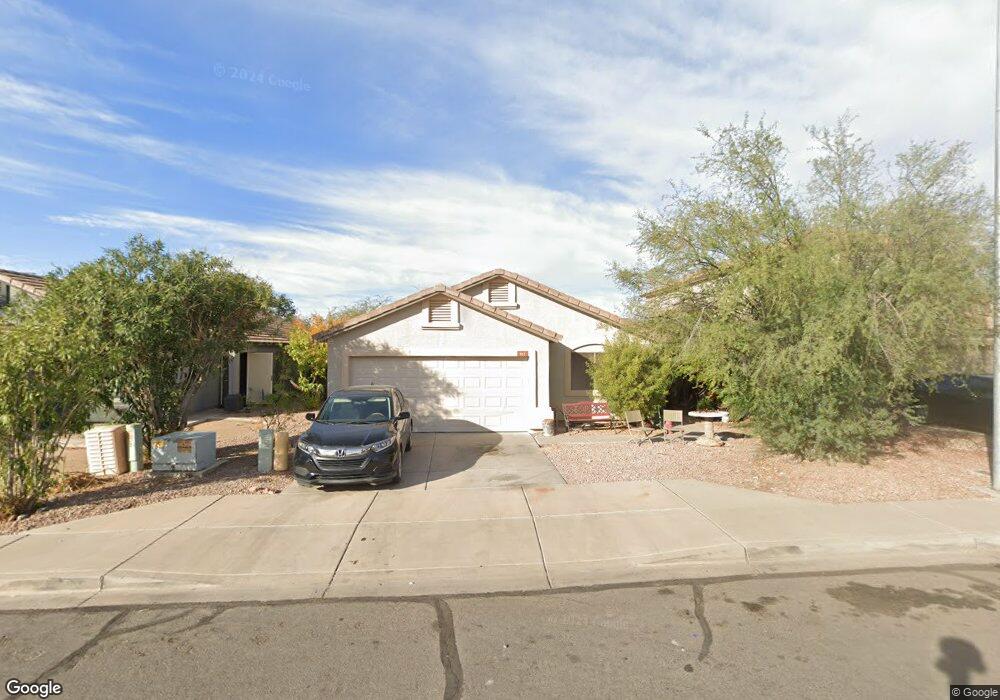
522 N 105th Place Mesa, AZ 85207
Northeast Mesa NeighborhoodEstimated Value: $357,218 - $449,000
Studio
2
Baths
1,648
Sq Ft
$247/Sq Ft
Est. Value
About This Home
This home is located at 522 N 105th Place, Mesa, AZ 85207 and is currently estimated at $407,055, approximately $246 per square foot. 522 N 105th Place is a home located in Maricopa County with nearby schools including Sousa Elementary School, Franklin at Brimhall Elementary School, and Franklin West Elementary School.
Ownership History
Date
Name
Owned For
Owner Type
Purchase Details
Closed on
Jan 12, 2006
Sold by
Hnatiuk Rochelle and Hnatiuk Rochelle L
Bought by
Wong David and Chan Loretta M
Current Estimated Value
Home Financials for this Owner
Home Financials are based on the most recent Mortgage that was taken out on this home.
Original Mortgage
$192,000
Outstanding Balance
$108,238
Interest Rate
6.32%
Mortgage Type
New Conventional
Estimated Equity
$298,817
Purchase Details
Closed on
Jul 16, 2002
Sold by
Sunstone Homes Inc
Bought by
Hnatiuk Rochelle L
Home Financials for this Owner
Home Financials are based on the most recent Mortgage that was taken out on this home.
Original Mortgage
$135,198
Interest Rate
6.69%
Mortgage Type
FHA
Purchase Details
Closed on
Apr 18, 2002
Sold by
Sahuaro Ventures Llc
Bought by
Sunstone Homes Inc and R W Harris Builders Inc
Home Financials for this Owner
Home Financials are based on the most recent Mortgage that was taken out on this home.
Original Mortgage
$108,000
Interest Rate
7.08%
Mortgage Type
Construction
Create a Home Valuation Report for This Property
The Home Valuation Report is an in-depth analysis detailing your home's value as well as a comparison with similar homes in the area
Home Values in the Area
Average Home Value in this Area
Purchase History
| Date | Buyer | Sale Price | Title Company |
|---|---|---|---|
| Wong David | $240,000 | Old Republic Title Agency | |
| Hnatiuk Rochelle L | $137,334 | Security Title Agency | |
| Sunstone Homes Inc | -- | Security Title Agency |
Source: Public Records
Mortgage History
| Date | Status | Borrower | Loan Amount |
|---|---|---|---|
| Open | Wong David | $192,000 | |
| Previous Owner | Hnatiuk Rochelle L | $135,198 | |
| Previous Owner | Sunstone Homes Inc | $108,000 |
Source: Public Records
Tax History Compared to Growth
Tax History
| Year | Tax Paid | Tax Assessment Tax Assessment Total Assessment is a certain percentage of the fair market value that is determined by local assessors to be the total taxable value of land and additions on the property. | Land | Improvement |
|---|---|---|---|---|
| 2025 | $1,468 | $14,675 | -- | -- |
| 2024 | $1,456 | $13,976 | -- | -- |
| 2023 | $1,456 | $29,250 | $5,850 | $23,400 |
| 2022 | $1,413 | $22,450 | $4,490 | $17,960 |
| 2021 | $1,395 | $21,030 | $4,200 | $16,830 |
| 2020 | $1,376 | $19,360 | $3,870 | $15,490 |
| 2019 | $1,438 | $17,260 | $3,450 | $13,810 |
| 2018 | $1,358 | $15,400 | $3,080 | $12,320 |
| 2017 | $1,316 | $14,470 | $2,890 | $11,580 |
| 2016 | $1,132 | $13,700 | $2,740 | $10,960 |
| 2015 | $1,186 | $12,720 | $2,540 | $10,180 |
Source: Public Records
Map
Nearby Homes
- 10620 E Caballero St
- 10530 E Baltimore St
- 658 N Merrill Rd
- 10558 E Boise St
- 345 N Signal Butte Rd Unit 23
- 322 N Wesley
- 604 N 101st Place
- 10517 E Evergreen St
- 10306 S Cave Spring Trail
- 10319 S Dutchman Dr
- 10282 S Dutchman Dr
- 10274 S Dutchman Dr
- 10303 S Cave Spring Trail
- 10325 S Cave Spring Trail
- 518 W Fremont Pass
- 10238 S Dutchman Dr
- 3147 W Shanley Ave
- 10312 S Cave Spring Trail
- 580 W Fremont Pass
- 315 N Keith St
- 528 N 105th Place
- 516 N 105th Place
- 534 N 105th Place
- 510 N 105th Place
- 540 N 105th Place
- 523 N 105th Place
- 529 N 105th Place
- 517 N 105th Place
- 535 N 105th Place
- 510 N 105th St
- 511 N 105th Place
- 518 N 105th St
- 546 N 105th Place
- 464 N 105th Place
- 541 N 105th Place
- 502 N 105th St
- 532 N 105th St
- 505 N 105th Place
- 552 N 105th Place
- 458 N 105th Place