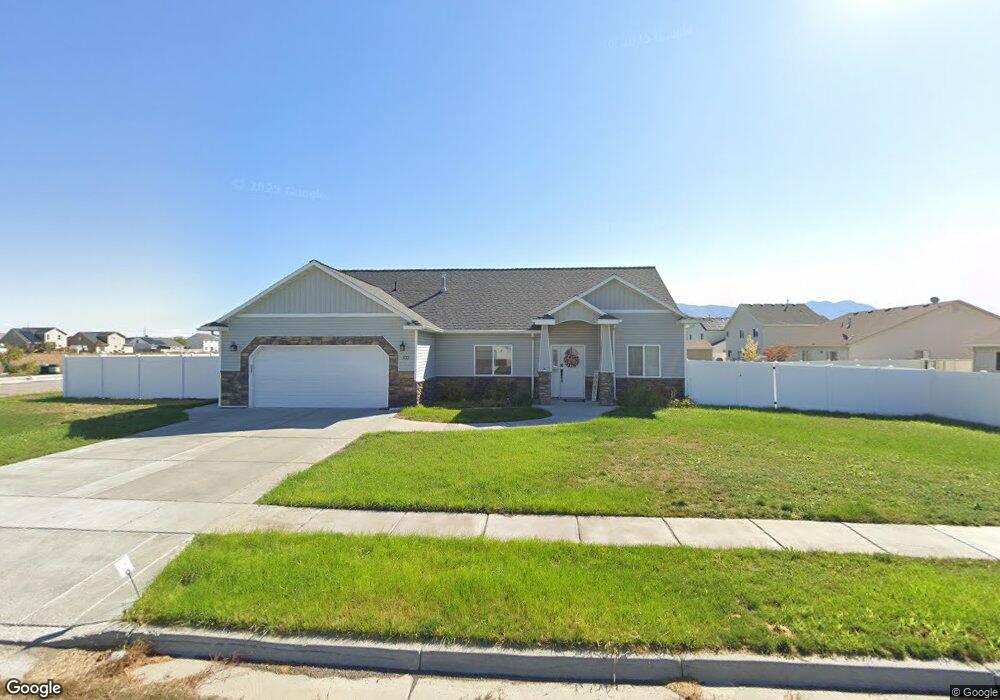
522 N 2650 W Tremonton, UT 84337
Estimated Value: $408,000 - $441,254
--
Bed
--
Bath
2,071
Sq Ft
$207/Sq Ft
Est. Value
About This Home
This home is located at 522 N 2650 W, Tremonton, UT 84337 and is currently estimated at $427,814, approximately $206 per square foot. 522 N 2650 W is a home with nearby schools including North Park School, Alice C. Harris Intermediate School, and Bear River Middle School.
Ownership History
Date
Name
Owned For
Owner Type
Purchase Details
Closed on
May 3, 2022
Sold by
Ross Hugie Glenna
Bought by
General Marty Hugie and Miller Sara
Current Estimated Value
Home Financials for this Owner
Home Financials are based on the most recent Mortgage that was taken out on this home.
Original Mortgage
$329,000
Outstanding Balance
$312,119
Interest Rate
5.1%
Mortgage Type
New Conventional
Estimated Equity
$115,695
Purchase Details
Closed on
May 20, 2008
Sold by
Mehi Inc
Bought by
Hugie Glenna R
Home Financials for this Owner
Home Financials are based on the most recent Mortgage that was taken out on this home.
Original Mortgage
$152,000
Interest Rate
5.88%
Mortgage Type
New Conventional
Purchase Details
Closed on
Feb 13, 2007
Sold by
Sorensen Chris D and Sorensen Nancy
Bought by
River Valley Development Llc
Create a Home Valuation Report for This Property
The Home Valuation Report is an in-depth analysis detailing your home's value as well as a comparison with similar homes in the area
Home Values in the Area
Average Home Value in this Area
Purchase History
| Date | Buyer | Sale Price | Title Company |
|---|---|---|---|
| General Marty Hugie | -- | Northern Title Company | |
| Hugie Glenna R | -- | -- | |
| River Valley Development Llc | -- | American Secure Title |
Source: Public Records
Mortgage History
| Date | Status | Borrower | Loan Amount |
|---|---|---|---|
| Open | General Marty Hugie | $329,000 | |
| Previous Owner | Hugie Glenna R | $152,000 |
Source: Public Records
Tax History Compared to Growth
Tax History
| Year | Tax Paid | Tax Assessment Tax Assessment Total Assessment is a certain percentage of the fair market value that is determined by local assessors to be the total taxable value of land and additions on the property. | Land | Improvement |
|---|---|---|---|---|
| 2025 | $2,569 | $429,568 | $135,000 | $294,568 |
| 2024 | $2,569 | $444,866 | $140,000 | $304,866 |
| 2023 | $2,785 | $473,404 | $145,000 | $328,404 |
| 2022 | $2,107 | $204,353 | $19,250 | $185,103 |
| 2021 | $1,886 | $253,024 | $35,000 | $218,024 |
| 2020 | $1,642 | $253,024 | $35,000 | $218,024 |
| 2019 | $1,526 | $125,368 | $19,250 | $106,118 |
| 2018 | $1,696 | $127,260 | $19,250 | $108,010 |
| 2017 | $1,752 | $231,381 | $19,250 | $196,381 |
| 2016 | $1,721 | $122,116 | $19,250 | $102,866 |
| 2015 | $1,560 | $112,765 | $19,250 | $93,515 |
| 2014 | $1,560 | $108,312 | $19,250 | $89,062 |
| 2013 | -- | $108,312 | $22,674 | $85,638 |
Source: Public Records
Map
Nearby Homes
- 483 N 2650 W Unit 2
- 475 N 2650 W
- 2556 W 600 N
- 2460 W 450 N Unit 10
- River Valley Plan at River Valley Townhome Community - River Valley
- 810 N 2300 W
- 3101 W 1000 N
- 877 N 2300 W
- 2618 W Mountain Rd
- 1069 N 2800 W
- 11148 N 8300 W Unit 11
- 11157 N 8300 W Unit 10
- 1081 N 2800 W
- 2436 W 1150 N Unit 12
- 2411 W 1150 N Unit 11
- 2389 W 1150 N Unit 10
- 2353 W 1150 N Unit 8
- 2371 W 1150 N Unit 9
- 2312 W 1150 N Unit 5
- 2342 W 1150 N Unit 4
- 2632 W 500 N
- 512 N 2650 W
- 2620 W 500 N
- 2620 W 500 N Unit 119
- 525 N 2650 W
- 517 N 2650 W
- 2604 W 500 N
- 535 N 2650 W
- 2662 W 500 N
- 545 N 2650 W Unit 134
- 545 N 2650 W
- 548 N 2650 W
- 2586 W 500 N
- 2586 W 500 N Unit 121
- 482 N 2650 W Unit 9
- 482 N 2650 W Unit 11
- 482 N 2650 W Unit 12
- 482 N 2650 W Unit 13
- 482 N 2650 W Unit 14
- 482 N 2650 W Unit 15