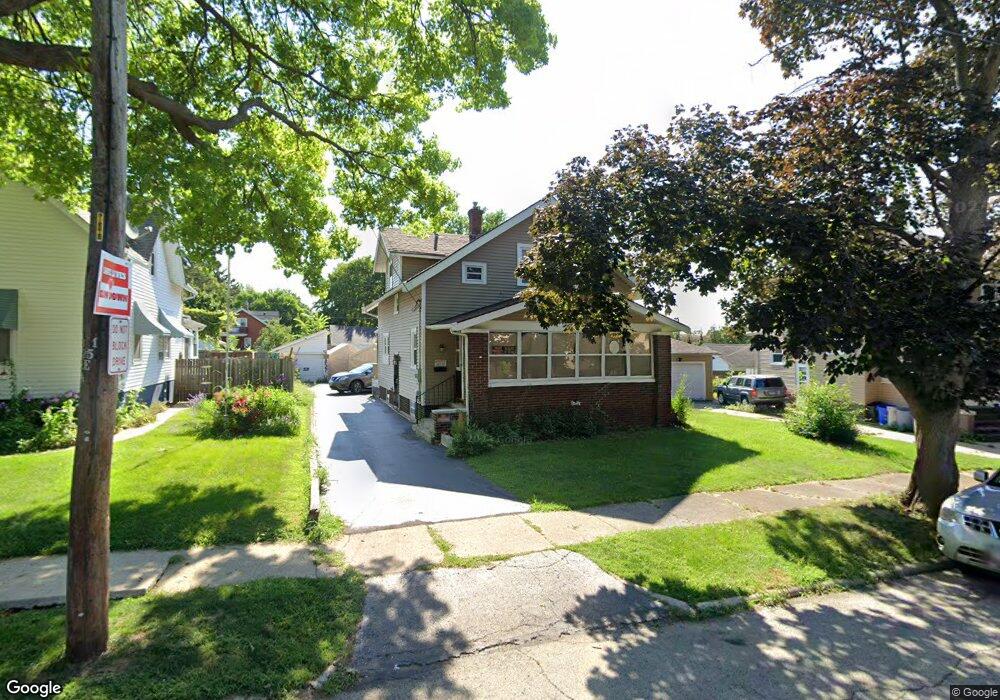
522 Pearl St Rockford, IL 61104
Highland Area NeighborhoodEstimated Value: $89,000 - $123,000
3
Beds
1
Bath
1,299
Sq Ft
$85/Sq Ft
Est. Value
About This Home
This home is located at 522 Pearl St, Rockford, IL 61104 and is currently estimated at $110,964, approximately $85 per square foot. 522 Pearl St is a home located in Winnebago County with nearby schools including Maud E. Johnson Elementary School, Abraham Lincoln Middle School, and Rockford East High School.
Ownership History
Date
Name
Owned For
Owner Type
Purchase Details
Closed on
Feb 12, 2021
Sold by
Kanel Paul D
Bought by
Vernia Michael A
Current Estimated Value
Home Financials for this Owner
Home Financials are based on the most recent Mortgage that was taken out on this home.
Original Mortgage
$50,500
Outstanding Balance
$45,584
Interest Rate
3.25%
Mortgage Type
New Conventional
Estimated Equity
$65,380
Create a Home Valuation Report for This Property
The Home Valuation Report is an in-depth analysis detailing your home's value as well as a comparison with similar homes in the area
Home Values in the Area
Average Home Value in this Area
Purchase History
| Date | Buyer | Sale Price | Title Company |
|---|---|---|---|
| Vernia Michael A | $55,000 | Cicero France & Alexander Pc |
Source: Public Records
Mortgage History
| Date | Status | Borrower | Loan Amount |
|---|---|---|---|
| Open | Vernia Michael A | $50,500 | |
| Closed | Vernia Michael A | $6,000 |
Source: Public Records
Tax History Compared to Growth
Tax History
| Year | Tax Paid | Tax Assessment Tax Assessment Total Assessment is a certain percentage of the fair market value that is determined by local assessors to be the total taxable value of land and additions on the property. | Land | Improvement |
|---|---|---|---|---|
| 2024 | $1,965 | $26,736 | $4,561 | $22,175 |
| 2023 | $1,825 | $23,575 | $4,022 | $19,553 |
| 2022 | $1,722 | $21,072 | $3,595 | $17,477 |
| 2021 | $2,368 | $19,321 | $3,296 | $16,025 |
| 2020 | $2,132 | $16,578 | $3,116 | $13,462 |
| 2019 | $2,117 | $15,801 | $2,970 | $12,831 |
| 2018 | $2,125 | $14,891 | $2,798 | $12,093 |
| 2017 | $2,114 | $14,251 | $2,678 | $11,573 |
| 2016 | $2,112 | $13,984 | $2,628 | $11,356 |
| 2015 | $1,070 | $13,984 | $2,628 | $11,356 |
| 2014 | $602 | $16,428 | $3,285 | $13,143 |
Source: Public Records
Map
Nearby Homes
- 2001 Charles St
- 1921 Charles St
- 625 16th St
- 430 Shaw St
- 1822 Charles St
- 320 Shaw St
- 335 Saint Louis Ave
- 408 S Gardiner Ave
- 1722 Charles St
- 131 S Chicago Ave
- 413 Hollister Ave
- 224 S Prospect St
- 1644 6th Ave
- 815 20th St
- 819 20th St
- 430 Hollister Ave
- 218 S Rockford Ave
- 1619 4th Ave
- 1619 Charles St
- 2231 9th Ave
- 516 Pearl St
- 526 Pearl St
- 512 Pearl St
- 2116 Charles St
- 2106 Charles St
- 2102 Charles St
- 521 Washington St
- 508 Pearl St
- 517 Washington St
- 523 Pearl St
- 519 Pearl St
- 511 Washington St
- 2026 Charles St
- 2011 Hutchins Ave
- 502 Pearl St
- 502 Pearl St Unit 2
- 502 Pearl St Unit 1
- 515 Pearl St
- 507 Washington St
- 2015 Hutchins Ave