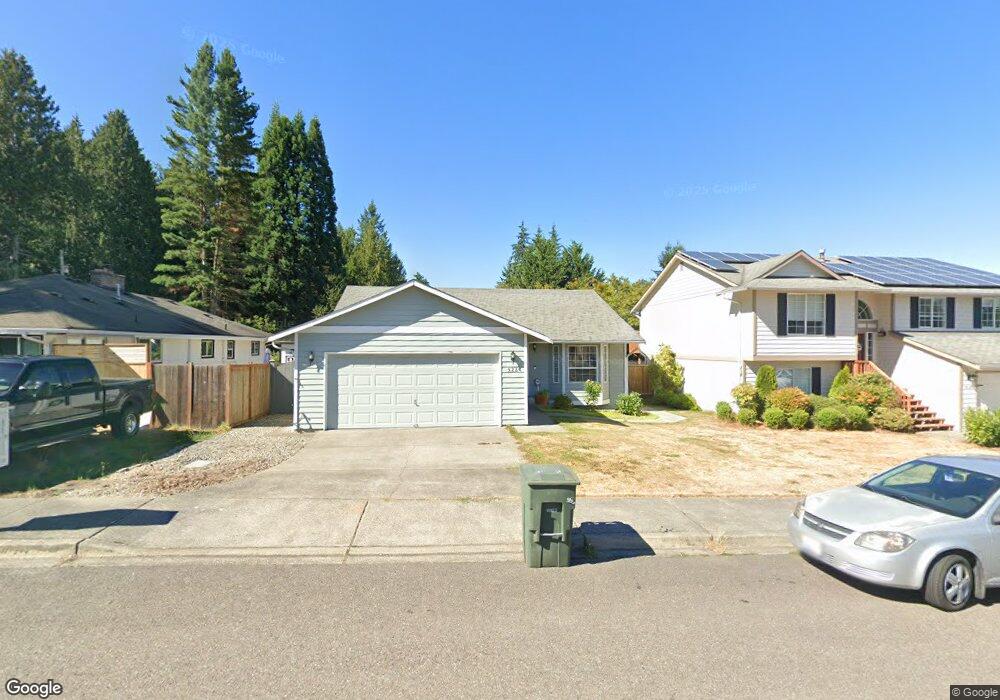
522 Rainbow Place Snohomish, WA 98290
Estimated Value: $629,809 - $717,000
3
Beds
2
Baths
1,250
Sq Ft
$536/Sq Ft
Est. Value
About This Home
This home is located at 522 Rainbow Place, Snohomish, WA 98290 and is currently estimated at $669,702, approximately $535 per square foot. 522 Rainbow Place is a home located in Snohomish County with nearby schools including Central Emerson Elementary School, Centennial Middle School, and Snohomish High School.
Ownership History
Date
Name
Owned For
Owner Type
Purchase Details
Closed on
Jan 31, 2006
Sold by
Coleman Frank E and Coleman Kathryn L
Bought by
Hall Kathryn L and Coleman Kathryn L
Current Estimated Value
Purchase Details
Closed on
Oct 21, 2002
Sold by
Zemola Albert G
Bought by
Coleman Frank E and Coleman Kathryn L
Home Financials for this Owner
Home Financials are based on the most recent Mortgage that was taken out on this home.
Original Mortgage
$152,200
Outstanding Balance
$63,482
Interest Rate
6.09%
Estimated Equity
$606,220
Purchase Details
Closed on
Jul 13, 1998
Sold by
Cmi Inc and Morrison Craig
Bought by
Zemola Albert G
Home Financials for this Owner
Home Financials are based on the most recent Mortgage that was taken out on this home.
Original Mortgage
$123,150
Interest Rate
7%
Create a Home Valuation Report for This Property
The Home Valuation Report is an in-depth analysis detailing your home's value as well as a comparison with similar homes in the area
Home Values in the Area
Average Home Value in this Area
Purchase History
| Date | Buyer | Sale Price | Title Company |
|---|---|---|---|
| Hall Kathryn L | -- | None Available | |
| Coleman Frank E | $190,250 | First American Title Ins Co | |
| Zemola Albert G | $153,950 | Evergreen Title Company Inc |
Source: Public Records
Mortgage History
| Date | Status | Borrower | Loan Amount |
|---|---|---|---|
| Open | Coleman Frank E | $152,200 | |
| Previous Owner | Zemola Albert G | $123,150 |
Source: Public Records
Tax History Compared to Growth
Tax History
| Year | Tax Paid | Tax Assessment Tax Assessment Total Assessment is a certain percentage of the fair market value that is determined by local assessors to be the total taxable value of land and additions on the property. | Land | Improvement |
|---|---|---|---|---|
| 2025 | $796 | $539,900 | $350,000 | $189,900 |
| 2024 | $796 | $529,900 | $340,000 | $189,900 |
| 2023 | $1,793 | $609,000 | $390,000 | $219,000 |
| 2022 | $2,204 | $450,700 | $265,000 | $185,700 |
| 2020 | $4,343 | $373,800 | $213,000 | $160,800 |
| 2019 | $4,043 | $355,100 | $197,000 | $158,100 |
| 2018 | $4,386 | $322,600 | $180,000 | $142,600 |
| 2017 | $3,852 | $288,800 | $156,000 | $132,800 |
| 2016 | $3,435 | $249,600 | $122,000 | $127,600 |
| 2015 | $3,279 | $228,100 | $103,000 | $125,100 |
| 2013 | $2,680 | $181,000 | $79,000 | $102,000 |
Source: Public Records
Map
Nearby Homes
- 5915 107th Ave SE
- 102 Stone Ridge Dr
- 0 Lot 1 Lake Ave
- 1721 Noble Ave
- 1400 30th St SE
- 5806 96th Dr SE
- 5418 96th Dr SE
- 10419 46th Place SE
- 4511 109th Ave SE
- 1900 Weaver Rd Unit E-102
- 1900 Weaver Rd Unit F102
- 1900 Weaver Rd Unit L102
- 2226 Cady Dr
- 1200 Bonneville Ave
- 2232 Cady Dr
- 1101 10th St Unit 31
- 12633 75th St SE
- 910 Mill Ave
- 4325 Fobes Rd
- 7429 129th Dr SE
- 518 Rainbow Place
- 526 Rainbow Place
- 514 Rainbow Place
- 5925 107th Ave SE
- 523 Rainbow Place
- 508 Rainbow Place
- 517 Rainbow Place
- 525 Rainbow Place
- 515 Rainbow Place
- 500 Rainbow Place
- 509 Rainbow Place
- 422 Rainbow Place
- 505 Rainbow Place
- 416 Rainbow Place
- 425 Rainbow Place
- 5901 107th Ave SE
- 414 Rainbow Place
- 421 Rainbow Place
- 412 Rainbow Place
- 410 Rainbow Place