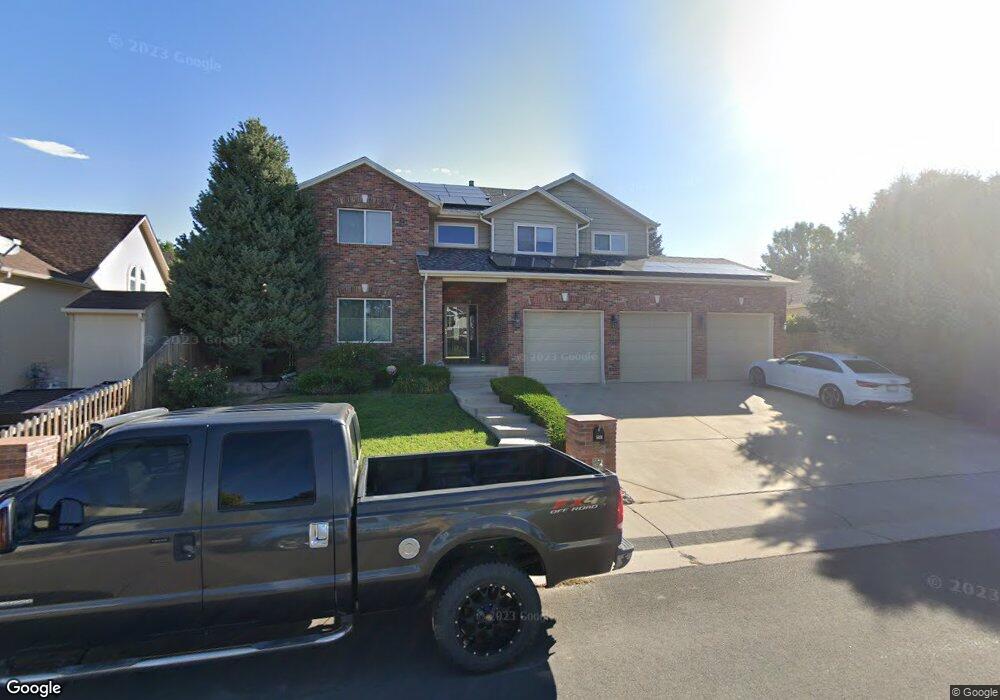
522 S 16th Ave Brighton, CO 80601
Estimated Value: $650,000 - $720,000
4
Beds
4
Baths
3,914
Sq Ft
$172/Sq Ft
Est. Value
About This Home
This home is located at 522 S 16th Ave, Brighton, CO 80601 and is currently estimated at $674,642, approximately $172 per square foot. 522 S 16th Ave is a home located in Adams County with nearby schools including Southeast Elementary School, Vikan Middle School, and Brighton High School.
Ownership History
Date
Name
Owned For
Owner Type
Purchase Details
Closed on
Aug 28, 2014
Sold by
Kroll Jamie A and Kroll Michael D
Bought by
Helm Ronald J and Helm Jennifer S
Current Estimated Value
Home Financials for this Owner
Home Financials are based on the most recent Mortgage that was taken out on this home.
Original Mortgage
$374,462
Outstanding Balance
$286,993
Interest Rate
4.17%
Mortgage Type
VA
Estimated Equity
$387,649
Purchase Details
Closed on
Jan 15, 2001
Sold by
Ewing Steven J and Ewing Tarese M
Bought by
Kroll Michael D and Kroll Jamie A
Home Financials for this Owner
Home Financials are based on the most recent Mortgage that was taken out on this home.
Original Mortgage
$245,600
Interest Rate
7.55%
Purchase Details
Closed on
Jan 24, 2000
Sold by
Elaine Glover Joyce
Bought by
Ewing Steven J and Ewing Tarese M
Purchase Details
Closed on
Sep 17, 1998
Sold by
Pacific Crest Communities Llc
Bought by
Glover Joyce Elaine
Create a Home Valuation Report for This Property
The Home Valuation Report is an in-depth analysis detailing your home's value as well as a comparison with similar homes in the area
Home Values in the Area
Average Home Value in this Area
Purchase History
| Date | Buyer | Sale Price | Title Company |
|---|---|---|---|
| Helm Ronald J | $362,500 | Land Title Guarantee Company | |
| Kroll Michael D | $307,000 | -- | |
| Ewing Steven J | $38,500 | -- | |
| Glover Joyce Elaine | $32,000 | -- |
Source: Public Records
Mortgage History
| Date | Status | Borrower | Loan Amount |
|---|---|---|---|
| Open | Helm Ronald J | $374,462 | |
| Previous Owner | Kroll Michael D | $245,600 |
Source: Public Records
Tax History Compared to Growth
Tax History
| Year | Tax Paid | Tax Assessment Tax Assessment Total Assessment is a certain percentage of the fair market value that is determined by local assessors to be the total taxable value of land and additions on the property. | Land | Improvement |
|---|---|---|---|---|
| 2024 | $4,674 | $41,250 | $7,500 | $33,750 |
| 2023 | $4,647 | $45,590 | $7,100 | $38,490 |
| 2022 | $3,780 | $34,080 | $7,850 | $26,230 |
| 2021 | $3,559 | $34,080 | $7,850 | $26,230 |
| 2020 | $3,420 | $34,230 | $8,080 | $26,150 |
| 2019 | $3,428 | $34,230 | $8,080 | $26,150 |
| 2018 | $2,941 | $29,280 | $6,480 | $22,800 |
| 2017 | $2,945 | $29,280 | $6,480 | $22,800 |
| 2016 | $2,825 | $27,940 | $5,010 | $22,930 |
| 2015 | $2,806 | $27,940 | $5,010 | $22,930 |
| 2014 | -- | $22,660 | $4,380 | $18,280 |
Source: Public Records
Map
Nearby Homes
- 434 Voiles Dr
- 406 S 16th Ave
- 628 S 16th Ave
- 2084 Donna Ct
- 595 Badger Creek Dr
- 792 S 12th Ave
- 791 S 21st Ct
- 316 S 22nd Ave
- 551 Longhurst Place
- 290 S 22nd Ave
- 465 S 24th Ave
- 797 S 11th Ave
- 2277 Wingler Place
- 2364 Cherry St
- 319 S 25th Ave
- 2411 Cherry Cir
- 933 Skeel St
- 253 S 25th Ave
- 321 S 26th Ave
- 175 S 10th Ave