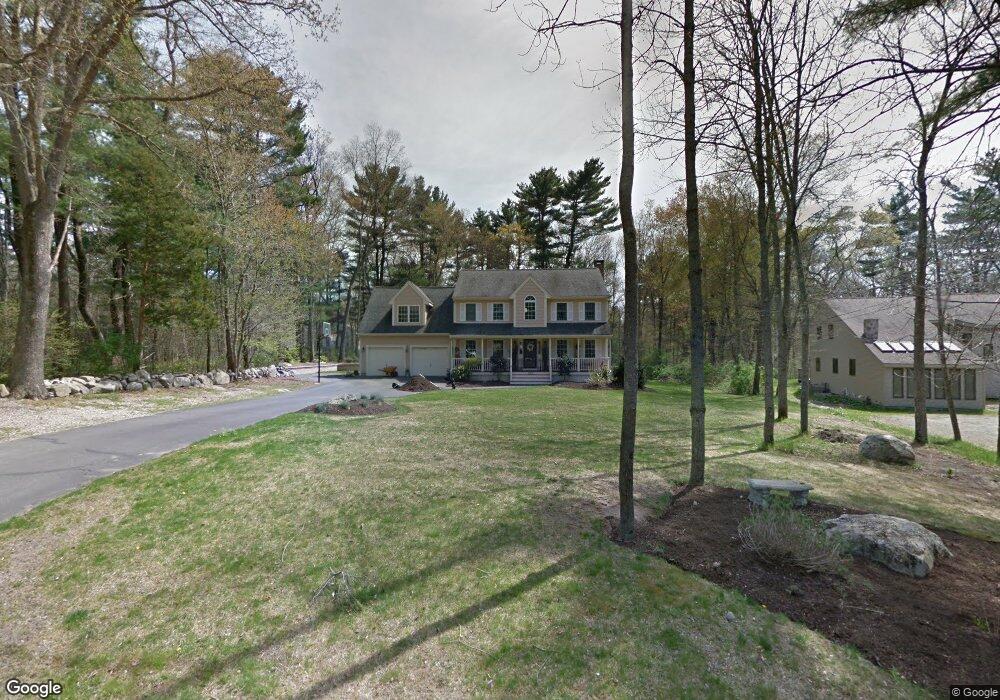
522 Spring St West Bridgewater, MA 02379
Estimated Value: $734,425 - $836,000
4
Beds
3
Baths
2,600
Sq Ft
$304/Sq Ft
Est. Value
About This Home
This home is located at 522 Spring St, West Bridgewater, MA 02379 and is currently estimated at $791,356, approximately $304 per square foot. 522 Spring St is a home located in Plymouth County with nearby schools including Spring Street Elementary School, Rose L. MacDonald Elementary School, and Howard Elementary School.
Ownership History
Date
Name
Owned For
Owner Type
Purchase Details
Closed on
Mar 14, 2008
Sold by
Gilbert Peter G and Rokes Richard
Bought by
Carruthers Spencer P and Wood-Carruthers Hollianne
Current Estimated Value
Home Financials for this Owner
Home Financials are based on the most recent Mortgage that was taken out on this home.
Original Mortgage
$348,000
Outstanding Balance
$216,566
Interest Rate
5.72%
Mortgage Type
Purchase Money Mortgage
Estimated Equity
$574,790
Purchase Details
Closed on
Oct 31, 2001
Sold by
Joyce Steven M
Bought by
Gilbert Peter G and Rokes Richard
Create a Home Valuation Report for This Property
The Home Valuation Report is an in-depth analysis detailing your home's value as well as a comparison with similar homes in the area
Home Values in the Area
Average Home Value in this Area
Purchase History
| Date | Buyer | Sale Price | Title Company |
|---|---|---|---|
| Carruthers Spencer P | $435,000 | -- | |
| Gilbert Peter G | $355,000 | -- |
Source: Public Records
Mortgage History
| Date | Status | Borrower | Loan Amount |
|---|---|---|---|
| Open | Gilbert Peter G | $348,000 | |
| Previous Owner | Gilbert Peter G | $99,100 | |
| Previous Owner | Gilbert Peter G | $359,000 |
Source: Public Records
Tax History
| Year | Tax Paid | Tax Assessment Tax Assessment Total Assessment is a certain percentage of the fair market value that is determined by local assessors to be the total taxable value of land and additions on the property. | Land | Improvement |
|---|---|---|---|---|
| 2025 | $8,978 | $656,800 | $254,000 | $402,800 |
| 2024 | $9,090 | $641,500 | $249,900 | $391,600 |
| 2023 | $8,919 | $580,300 | $233,500 | $346,800 |
| 2022 | $8,394 | $517,500 | $194,600 | $322,900 |
| 2021 | $7,455 | $470,100 | $176,100 | $294,000 |
| 2020 | $7,753 | $473,600 | $176,100 | $297,500 |
| 2019 | $7,073 | $462,600 | $176,100 | $286,500 |
| 2018 | $20,440 | $441,500 | $163,900 | $277,600 |
| 2017 | $20,121 | $423,100 | $153,600 | $269,500 |
| 2016 | $7,432 | $412,900 | $143,400 | $269,500 |
| 2015 | $7,185 | $403,400 | $143,400 | $260,000 |
| 2014 | $6,652 | $403,400 | $143,400 | $260,000 |
Source: Public Records
Map
Nearby Homes
- 19 Progressive Ave
- 22 Grant St
- 616 N Elm St
- Lots 1-4 Copeland St
- Lot 1 Jeffrey Ln
- 93 Prospect St
- 12 Finny's Way
- 326 Copeland St
- 10 Charles St
- 16 Jason Way
- 47 Southworth St
- 41 Victorian Way
- 603 W Chestnut St
- 9 Longworth Ave Unit 135
- 9 Longworth Ave Unit 132
- 8 Marisa Dr
- 18 American Ave
- 35 Longworth Ave Unit 25
- 16 Liberty St
- 31 Friendship Dr
Your Personal Tour Guide
Ask me questions while you tour the home.