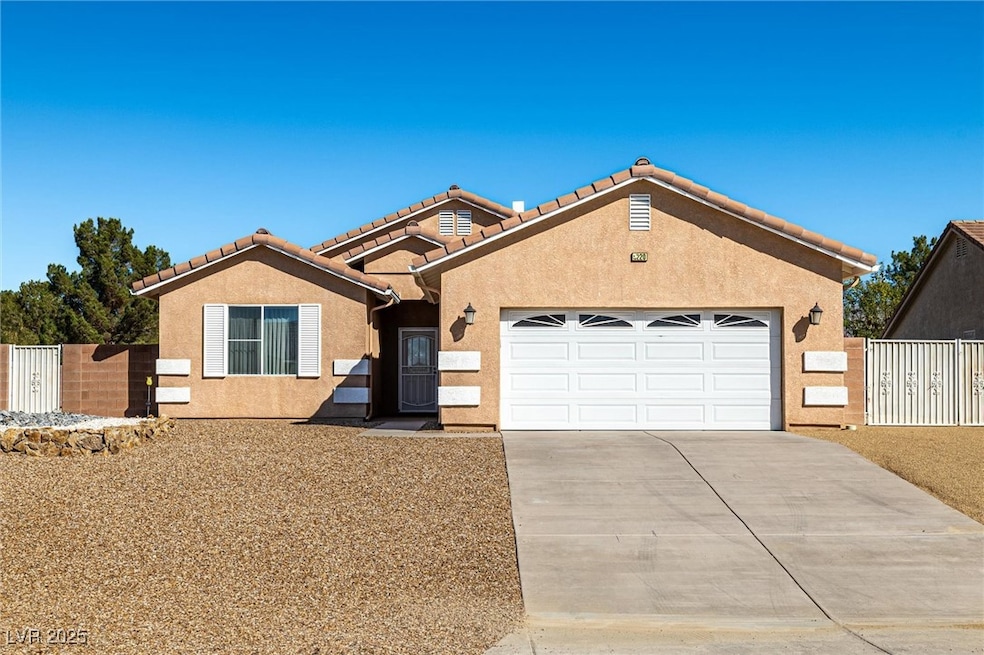
5220 Chasemoor St Pahrump, NV 89061
Estimated payment $2,653/month
Highlights
- Garage Cooled
- Solar Power System
- Adjacent to Greenbelt
- RV Access or Parking
- Mountain View
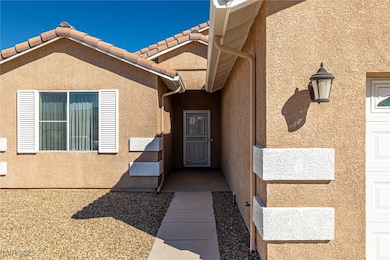
- Covered Patio or Porch
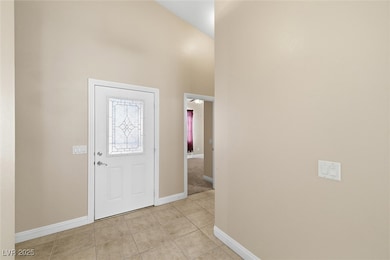
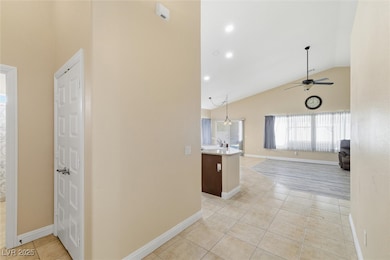
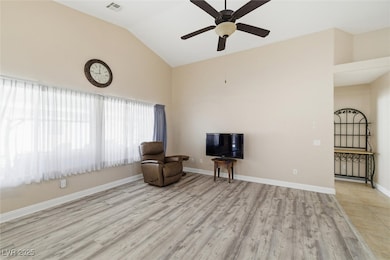
About This Home
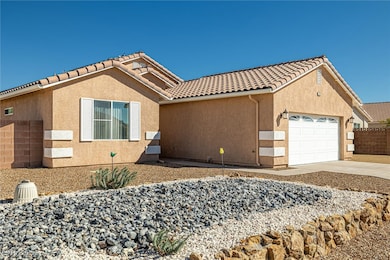
Beautifully maintained 3 bed, 2 bath home in the desirable Artesia community on the south end of Pahrump! Features a 2-car attached garage plus a fully finished 4-car detached garage with brand new mini-split A/C. Additional 20x10 room with its own mini-split—perfect for an office, gym, or hobby space. Enjoy 40 paid-off solar panels, propane for stove, heater, and included gas grill. Covered back patio with electric sun shade and power, no rear neighbors, and gate access to a greenbelt walking path. Comfort, privacy, and functionality all in one!
Listing Agent
Nevada Realty Brokerage Phone: 775-727-1818 License #S.0203590 Listed on: 10/20/2025
Home Details
Home Type
- Single Family
Est. Annual Taxes
- $1,791
Year Built
- Built in 2007
Lot Details
- 0.33 Acre Lot
- Adjacent to Greenbelt
- South Facing Home
- Back Yard Fenced
- Block Wall Fence
- Aluminum or Metal Fence
- Electric Fence
- Drip System Landscaping
HOA Fees
- $23 Monthly HOA Fees
Parking
- 6 Car Garage
- Garage Cooled
- Parking Storage or Cabinetry
- Workshop in Garage
- Inside Entrance
- Garage Door Opener
- RV Access or Parking
Property Views
- Mountain
- Park or Greenbelt
Home Design
- Tile Roof
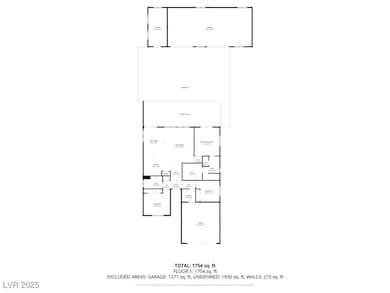
Interior Spaces
- 1,622 Sq Ft Home
- 1-Story Property
- Ceiling Fan
- Double Pane Windows
- Awning
- Drapes & Rods
Kitchen
- Gas Range
- Microwave
- Dishwasher
- Disposal
Flooring
- Carpet
- Tile
- Luxury Vinyl Plank Tile
Bedrooms and Bathrooms
- 3 Bedrooms
- 2 Full Bathrooms
Laundry
- Laundry Room
- Laundry on main level
- Electric Dryer Hookup
Eco-Friendly Details
- Energy-Efficient Windows
- Solar Power System
- Solar owned by seller
- Sprinkler System
Outdoor Features
- Covered Patio or Porch
- Outdoor Grill
Schools
- Hafen Elementary School
- Rosemary Clarke Middle School
- Pahrump Valley High School
Utilities
- Central Heating and Cooling System
- Heating System Uses Gas
- Underground Utilities
- 220 Volts in Garage
- Water Softener is Owned
Community Details
Overview
- Association fees include management, ground maintenance
- Artesia Association, Phone Number (775) 537-1900
- Artesiahafen Ranch Phs#3 Subdivision
Recreation
- Park
Map
Home Values in the Area
Average Home Value in this Area
Tax History
| Year | Tax Paid | Tax Assessment Tax Assessment Total Assessment is a certain percentage of the fair market value that is determined by local assessors to be the total taxable value of land and additions on the property. | Land | Improvement |
|---|---|---|---|---|
| 2025 | $1,674 | $84,498 | $11,572 | $72,926 |
| 2024 | $1,674 | $82,879 | $8,875 | $74,004 |
| 2023 | $1,674 | $76,802 | $8,875 | $67,927 |
| 2022 | $1,585 | $68,196 | $6,339 | $61,857 |
| 2021 | $1,441 | $62,513 | $5,071 | $57,442 |
| 2020 | $1,593 | $62,395 | $5,071 | $57,324 |
| 2019 | $1,546 | $73,647 | $5,071 | $68,576 |
| 2018 | $1,477 | $70,362 | $4,057 | $66,305 |
| 2017 | $1,419 | $56,853 | $4,057 | $52,796 |
| 2016 | $1,384 | $40,712 | $4,057 | $36,655 |
| 2015 | $1,382 | $37,831 | $4,057 | $33,774 |
| 2014 | $1,340 | $40,730 | $4,057 | $36,673 |
Property History
| Date | Event | Price | List to Sale | Price per Sq Ft |
|---|---|---|---|---|
| 10/20/2025 10/20/25 | For Sale | $469,900 | -- | $290 / Sq Ft |
Purchase History
| Date | Type | Sale Price | Title Company |
|---|---|---|---|
| Interfamily Deed Transfer | -- | None Available | |
| Bargain Sale Deed | $125,000 | Mesquite Title Company | |
| Bargain Sale Deed | $125,000 | Mesquite Title Company | |
| Quit Claim Deed | -- | None Available |
Mortgage History
| Date | Status | Loan Amount | Loan Type |
|---|---|---|---|
| Previous Owner | $100,000 | New Conventional |
Source: Las Vegas REALTORS®
MLS Number: 2728795
APN: 43-621-03
Disclaimer: Certain information contained herein is derived from information provided by parties other than Homes.com. All information provided is deemed reliable, but is not guaranteed to be accurate and should be independently verified.
![]() The data relating to real estate for sale on this web site comes in part from the INTERNET DATA EXCHANGE Program of the Greater Las Vegas Association of REALTORS® MLS. Real estate listings held by brokerage firms other than this site owner are marked with the IDX logo. Information is deemed reliable but not guaranteed. Copyright 2025 of the Greater Las Vegas Association of REALTORS® MLS. All rights reserved.
The data relating to real estate for sale on this web site comes in part from the INTERNET DATA EXCHANGE Program of the Greater Las Vegas Association of REALTORS® MLS. Real estate listings held by brokerage firms other than this site owner are marked with the IDX logo. Information is deemed reliable but not guaranteed. Copyright 2025 of the Greater Las Vegas Association of REALTORS® MLS. All rights reserved.
- 5170 Fairmont St
- 5371 Bridger St
- 5351 Fieldstone Dr
- 5380 E Chasemoor St
- 6751 Stubblefield Dr
- 6380 Waterford St
- 6440 Montclair St
- 6671 White Eagle Dr
- 5121 Andover Ct
- 6780 Sandpebble St
- 5060 Wheatland Dr
- 6650 Southgate St
- 5522 Saddletree Rd
- 5521 Saddletree Rd
- 6431 Sundance St
- 6761 Sandpebble St
- 5400 Grain Mill Rd
- 6860 Stubblefield Dr
- 6751 Sandpebble St
- 5111 Andover Ct
- 6780 Sandpebble St
- 4360 Savoy Blvd
- 4360 Savoy Blvd
- 4360 Savoy Blvd
- 4101 E Paiute
- 5771 Alfano Ave
- 7701 Arabian Way
- 5434 E Cansano St
- 6011 E Trevano Ave
- 4775 E Beacon Ridge Dr
- 5357 Eleganza Ave
- 3120 Easy St
- 4096 E Cactus Canyon Dr
- 4936 Semifonte Dr
- 5011 Monte Penne Way
- 4317 La Romita St
- 4775 Lorenzo Way
- 6060 Superior Ln
- 3801 Malibou Ave
- 3741 Malibou Ave
