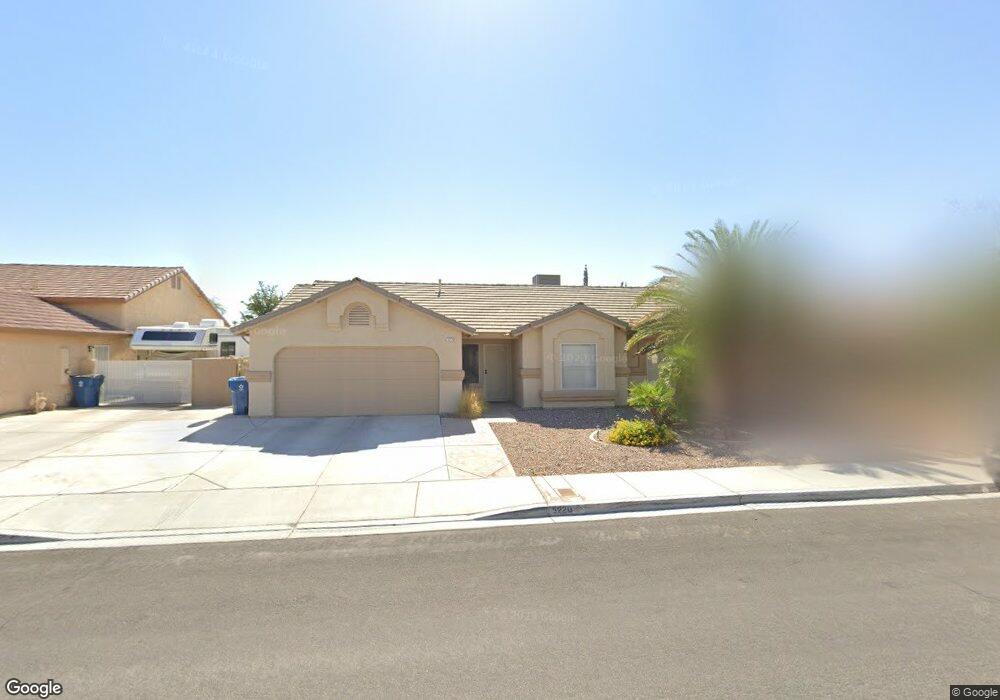
5220 Dana Springs Way Las Vegas, NV 89130
North Cheyenne NeighborhoodEstimated Value: $419,055 - $446,000
3
Beds
2
Baths
1,344
Sq Ft
$319/Sq Ft
Est. Value
About This Home
This home is located at 5220 Dana Springs Way, Las Vegas, NV 89130 and is currently estimated at $428,514, approximately $318 per square foot. 5220 Dana Springs Way is a home located in Clark County with nearby schools including Ernest May Elementary School, Theron L Swainston Middle School, and Shadow Ridge High School.
Ownership History
Date
Name
Owned For
Owner Type
Purchase Details
Closed on
Dec 23, 2002
Sold by
Morrello Anthony L and Morrello Lorraine
Bought by
Sprunger Steven N and Sprunger Sharon R
Current Estimated Value
Home Financials for this Owner
Home Financials are based on the most recent Mortgage that was taken out on this home.
Original Mortgage
$130,000
Interest Rate
5.93%
Purchase Details
Closed on
Oct 18, 1994
Sold by
Confetti Joint Venture
Bought by
Morrello Anthony L and Morrello Lorraine
Home Financials for this Owner
Home Financials are based on the most recent Mortgage that was taken out on this home.
Original Mortgage
$105,675
Interest Rate
8.54%
Mortgage Type
FHA
Purchase Details
Closed on
Oct 17, 1994
Sold by
The Brendan & Stella Bowyer Llc
Bought by
Confetti Joint Venture
Home Financials for this Owner
Home Financials are based on the most recent Mortgage that was taken out on this home.
Original Mortgage
$105,675
Interest Rate
8.54%
Mortgage Type
FHA
Create a Home Valuation Report for This Property
The Home Valuation Report is an in-depth analysis detailing your home's value as well as a comparison with similar homes in the area
Home Values in the Area
Average Home Value in this Area
Purchase History
| Date | Buyer | Sale Price | Title Company |
|---|---|---|---|
| Sprunger Steven N | $162,500 | Pioneer National Title | |
| Morrello Anthony L | $107,000 | United Title | |
| Confetti Joint Venture | $9,000 | United Title |
Source: Public Records
Mortgage History
| Date | Status | Borrower | Loan Amount |
|---|---|---|---|
| Previous Owner | Sprunger Steven N | $130,000 | |
| Previous Owner | Morrello Anthony L | $105,675 |
Source: Public Records
Tax History Compared to Growth
Tax History
| Year | Tax Paid | Tax Assessment Tax Assessment Total Assessment is a certain percentage of the fair market value that is determined by local assessors to be the total taxable value of land and additions on the property. | Land | Improvement |
|---|---|---|---|---|
| 2025 | $1,928 | $100,788 | $39,900 | $60,888 |
| 2024 | $1,873 | $100,788 | $39,900 | $60,888 |
| 2023 | $1,873 | $94,424 | $36,750 | $57,674 |
| 2022 | $1,818 | $80,425 | $27,300 | $53,125 |
| 2021 | $1,765 | $73,331 | $22,750 | $50,581 |
| 2020 | $1,711 | $73,091 | $22,750 | $50,341 |
| 2019 | $1,661 | $72,494 | $22,750 | $49,744 |
| 2018 | $1,613 | $68,445 | $20,300 | $48,145 |
| 2017 | $2,272 | $69,295 | $20,300 | $48,995 |
| 2016 | $1,528 | $64,871 | $15,750 | $49,121 |
| 2015 | $1,524 | $48,351 | $9,450 | $38,901 |
| 2014 | $1,479 | $43,791 | $8,750 | $35,041 |
Source: Public Records
Map
Nearby Homes
- 6513 Echo Crest Ave
- 6540 W Hammer Ln
- 6613 Sand Bench Ave
- 6405 Steamship Ct
- 5364 Rhett St
- 6701 Squaw Mountain Dr Unit 201
- 6705 Squaw Mountain Dr Unit 102
- 6704 Indian Chief Dr Unit 101
- 5522 Porcupine Rim St
- 5060 Serene Skies St
- 6406 Veranda Falls Ct
- 6825 Rio Sands Ct
- 5059 Tranquil View St
- 5409 Flora Spray St
- 5329 Bright Sun Ct
- 6904 Indian Chief Dr Unit 201
- 6345 Citrine Ave
- 6507 Dove Point Place
- 6345 Cinnabar Ridge Ave
- 6458 Secret Grove Ave
- 5216 Dana Springs Way
- 5229 Rebecca Rd
- 5225 Rebecca Rd
- 5233 Rebecca Rd
- 5212 Dana Springs Way
- 5228 Dana Springs Way
- 5221 Dana Springs Way
- 5217 Dana Springs Way
- 5217 Dana Springs Way
- 5217 Dana Springs Way
- 5221 Rebecca Rd
- 5237 Rebecca Rd
- 6501 Echo Crest Ave
- 5213 Dana Springs Way
- 5208 Dana Springs Way Unit 2
- 5209 Dana Springs Way
- 5217 Rebecca Rd
- 6505 Echo Crest Ave
- 5216 Sun Gem Ct
- 6452 Fisher Ave