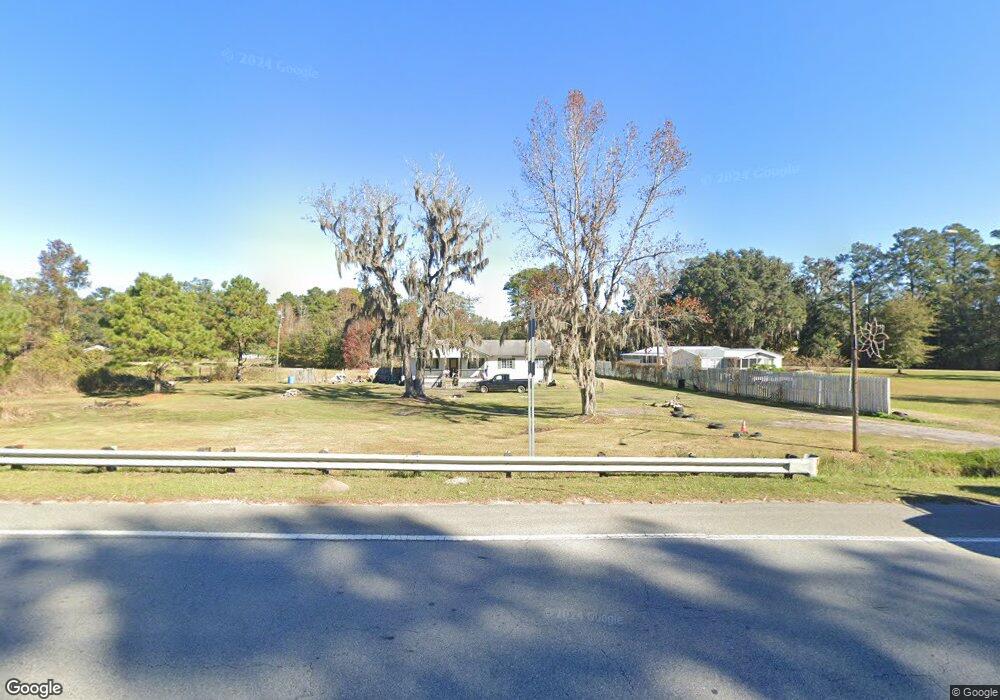
5220 S Coastal Hwy Riceboro, GA 31323
Estimated Value: $110,000 - $200,565
4
Beds
2
Baths
1,458
Sq Ft
$97/Sq Ft
Est. Value
About This Home
This home is located at 5220 S Coastal Hwy, Riceboro, GA 31323 and is currently estimated at $142,141, approximately $97 per square foot. 5220 S Coastal Hwy is a home located in Liberty County with nearby schools including Liberty Elementary School, Midway Middle School, and Liberty County High School.
Ownership History
Date
Name
Owned For
Owner Type
Purchase Details
Closed on
Sep 9, 2025
Sold by
Nrz Reo Inventory 2 Llc
Bought by
Clancy Eric G
Current Estimated Value
Purchase Details
Closed on
Jan 7, 2025
Sold by
Andrews Terry
Bought by
Nrz Reo Inventory 2 Llc and Nrz Reo Inventory Ii Llc
Purchase Details
Closed on
Jun 20, 2014
Sold by
Green Tree Servicing Llc
Bought by
Andrews Terry
Purchase Details
Closed on
Mar 4, 2014
Sold by
Stacy Chineattra
Bought by
Green Tree Servicing Llc
Purchase Details
Closed on
Jan 22, 2007
Sold by
Walter Mortgage Company
Bought by
Stacy Chineattra Y
Purchase Details
Closed on
May 8, 2006
Sold by
Walter Mortgage Company
Bought by
Stacy Chineattra Y
Home Financials for this Owner
Home Financials are based on the most recent Mortgage that was taken out on this home.
Original Mortgage
$194,028
Interest Rate
6.39%
Mortgage Type
New Conventional
Purchase Details
Closed on
Mar 7, 2006
Sold by
Mellerson Danial D and Mellerson Mamie A
Bought by
Walter Mortgage Company
Purchase Details
Closed on
Mar 22, 2000
Sold by
Mellerson Mamie A
Bought by
Mellerson Danial D
Purchase Details
Closed on
Feb 29, 1996
Sold by
Frazier Pulaski
Bought by
Stacy Mamie
Create a Home Valuation Report for This Property
The Home Valuation Report is an in-depth analysis detailing your home's value as well as a comparison with similar homes in the area
Home Values in the Area
Average Home Value in this Area
Purchase History
| Date | Buyer | Sale Price | Title Company |
|---|---|---|---|
| Clancy Eric G | $35,000 | -- | |
| Nrz Reo Inventory 2 Llc | $106,847 | -- | |
| Andrews Terry | $59,000 | -- | |
| Green Tree Servicing Llc | $72,800 | -- | |
| Stacy Chineattra Y | $68,500 | -- | |
| Stacy Chineattra Y | $68,500 | -- | |
| Walter Mortgage Company | $80,500 | -- | |
| Mellerson Danial D | -- | -- | |
| Stacy Mamie | -- | -- |
Source: Public Records
Mortgage History
| Date | Status | Borrower | Loan Amount |
|---|---|---|---|
| Previous Owner | Stacy Chineattra Y | $194,028 |
Source: Public Records
Tax History Compared to Growth
Tax History
| Year | Tax Paid | Tax Assessment Tax Assessment Total Assessment is a certain percentage of the fair market value that is determined by local assessors to be the total taxable value of land and additions on the property. | Land | Improvement |
|---|---|---|---|---|
| 2024 | $2,219 | $52,588 | $4,200 | $48,388 |
| 2023 | $2,219 | $47,114 | $4,200 | $42,914 |
| 2022 | $1,542 | $38,754 | $4,200 | $34,554 |
| 2021 | $1,398 | $35,141 | $4,200 | $30,941 |
| 2020 | $1,415 | $35,523 | $4,200 | $31,323 |
| 2019 | $1,394 | $35,905 | $4,200 | $31,705 |
| 2018 | $1,364 | $35,531 | $3,444 | $32,087 |
| 2017 | $1,524 | $35,913 | $3,444 | $32,469 |
| 2016 | $1,299 | $36,295 | $3,444 | $32,851 |
| 2015 | $1,116 | $35,500 | $2,650 | $32,851 |
| 2014 | $1,116 | $37,596 | $2,953 | $34,643 |
| 2013 | -- | $33,958 | $2,704 | $31,254 |
Source: Public Records
Map
Nearby Homes
- lot 1 Frazier Dr
- lot 2 Frazier Dr
- 5.8 ACRES S Coastal Hwy
- 6078 S Coastal Hwy
- 72 Big Oak Rd
- 3 and M3 Big Oak Rd
- 3 & M3 Big Oak Rd
- 390 Big Oak Rd
- 0 Sandy Run Rd Unit 10592196
- 8578 E B Cooper Hwy
- 21 Smiley Loop Rd
- 211 Smiley Loop Rd
- 1300 Retreat Rd
- 1123 Stone Ct
- 1615 Retreat Rd
- 984 Stone Ct
- 422 Buckingham Dr
- LOT 22 Bermuda Bluff Ln
- LOT 8 Bermuda Bluff Ln
- LOT 23 Bermuda Bluff Ln
- 188 Frazier Dr
- 214 Frazier Dr
- 89 Frazier Dr
- 139 Frazier Dr
- 179 Frazier Dr
- 5318 S Coastal Hwy
- 203 Frazier Dr
- 124 Dogwood St
- 5391 S Coastal Hwy
- 134 Dogwood St
- 266 Frazier Dr
- 259 Frazier Dr
- 2 Frazier Dr
- N Frazier Dr Unit Lots 1 & 2
- 0 Frazier Dr
- 289 Frazier Dr
- 0 S
- 0 S Hwy 17 Unit 134162
- 0 S Hwy 17 Unit 148318
- 0 S Hwy 17 Unit 181822