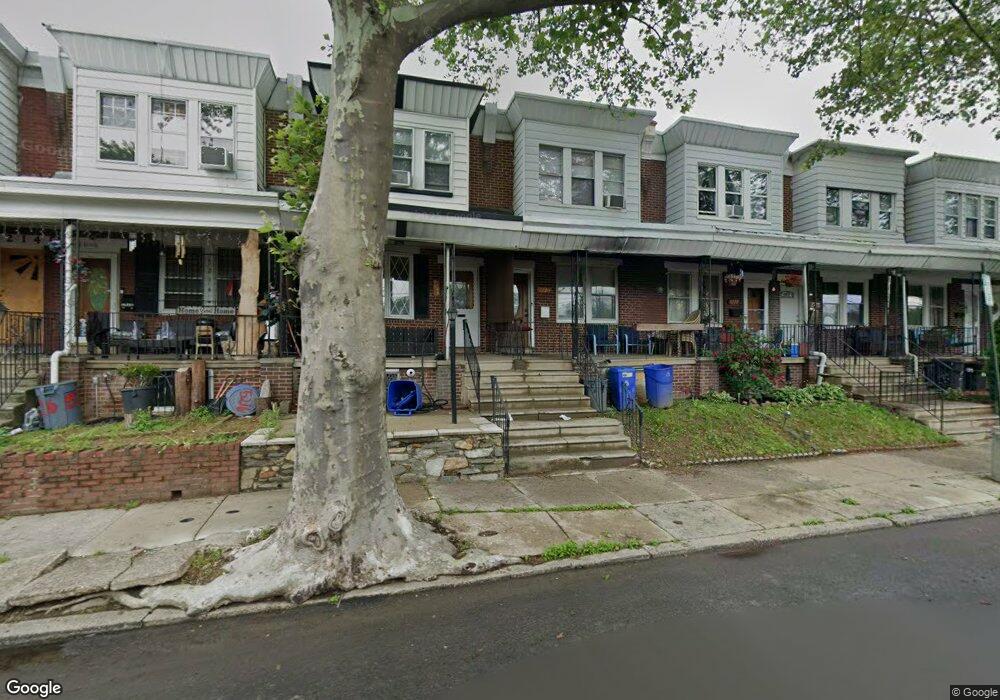
5220 Saul St Philadelphia, PA 19124
Frankford NeighborhoodEstimated Value: $178,000 - $205,836
3
Beds
1
Bath
1,068
Sq Ft
$183/Sq Ft
Est. Value
About This Home
This home is located at 5220 Saul St, Philadelphia, PA 19124 and is currently estimated at $195,959, approximately $183 per square foot. 5220 Saul St is a home located in Philadelphia County with nearby schools including Frankford High School, The Philadelphia Charter School for the Arts & Sciences, and Mastery Schools Smedley Elementary.
Ownership History
Date
Name
Owned For
Owner Type
Purchase Details
Closed on
Nov 17, 2009
Sold by
Davis Patricia J and Estate Of Marion R Vandergrift
Bought by
Picart Eliana
Current Estimated Value
Home Financials for this Owner
Home Financials are based on the most recent Mortgage that was taken out on this home.
Original Mortgage
$66,475
Outstanding Balance
$43,228
Interest Rate
4.92%
Mortgage Type
FHA
Estimated Equity
$152,731
Create a Home Valuation Report for This Property
The Home Valuation Report is an in-depth analysis detailing your home's value as well as a comparison with similar homes in the area
Home Values in the Area
Average Home Value in this Area
Purchase History
| Date | Buyer | Sale Price | Title Company |
|---|---|---|---|
| Picart Eliana | $70,500 | Madison Title Agency |
Source: Public Records
Mortgage History
| Date | Status | Borrower | Loan Amount |
|---|---|---|---|
| Open | Picart Eliana | $66,475 |
Source: Public Records
Tax History Compared to Growth
Tax History
| Year | Tax Paid | Tax Assessment Tax Assessment Total Assessment is a certain percentage of the fair market value that is determined by local assessors to be the total taxable value of land and additions on the property. | Land | Improvement |
|---|---|---|---|---|
| 2025 | $1,831 | $163,600 | $32,720 | $130,880 |
| 2024 | $1,831 | $163,600 | $32,720 | $130,880 |
| 2023 | $1,831 | $130,800 | $26,160 | $104,640 |
| 2022 | $665 | $85,800 | $26,160 | $59,640 |
| 2021 | $1,295 | $0 | $0 | $0 |
| 2020 | $1,295 | $0 | $0 | $0 |
| 2019 | $1,243 | $0 | $0 | $0 |
| 2018 | $1,233 | $0 | $0 | $0 |
| 2017 | $1,233 | $0 | $0 | $0 |
| 2016 | $813 | $0 | $0 | $0 |
| 2015 | $779 | $0 | $0 | $0 |
| 2014 | -- | $88,100 | $17,808 | $70,292 |
| 2012 | -- | $11,872 | $1,282 | $10,590 |
Source: Public Records
Map
Nearby Homes